|
Download Data (XLS File) |
|
||||||||
|
||||||||
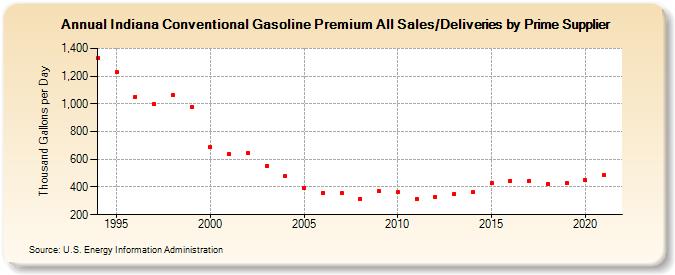
| Indiana Conventional Gasoline Premium All Sales/Deliveries by Prime Supplier (Thousand Gallons per Day) | ||||||||
| Decade | Year-0 | Year-1 | Year-2 | Year-3 | Year-4 | Year-5 | Year-6 | Year-7 | Year-8 | Year-9 |
|---|---|---|---|---|---|---|---|---|---|---|
| 1990's | 1,332.4 | 1,227.6 | 1,051.4 | 995.9 | 1,061.4 | 976.9 | ||||
| 2000's | 689.6 | 636.9 | 648.4 | 553.8 | 477.3 | 395.4 | 359.2 | 353.5 | 315.1 | 370.0 |
| 2010's | 362.1 | 315.7 | 329.5 | 352.5 | 362.2 | 427.5 | 443.9 | 443.7 | 421.7 | 430.1 |
| 2020's | 446.9 |
| - = No Data Reported; -- = Not Applicable; NA = Not Available; W = Withheld to avoid disclosure of individual company data. |
| Release Date: 6/1/2022 |
| Next Release Date: TBD |