|
Download Data (XLS File) |
|
||||||||
|
||||||||
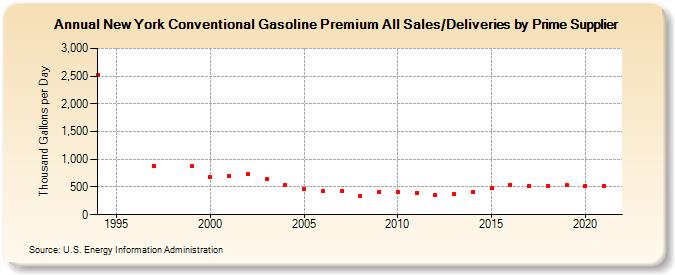
| New York Conventional Gasoline Premium All Sales/Deliveries by Prime Supplier (Thousand Gallons per Day) | ||||||||
| Decade | Year-0 | Year-1 | Year-2 | Year-3 | Year-4 | Year-5 | Year-6 | Year-7 | Year-8 | Year-9 |
|---|---|---|---|---|---|---|---|---|---|---|
| 1990's | 2,513.2 | W | W | 883.3 | W | 878.6 | ||||
| 2000's | 676.5 | 698.9 | 733.3 | 636.0 | 537.0 | 459.3 | 420.3 | 431.2 | 341.7 | 403.1 |
| 2010's | 417.8 | 400.5 | 355.8 | 372.2 | 410.0 | 478.1 | 543.4 | 518.5 | 524.7 | 529.9 |
| 2020's | 515.6 |
| - = No Data Reported; -- = Not Applicable; NA = Not Available; W = Withheld to avoid disclosure of individual company data. |
| Release Date: 6/1/2022 |
| Next Release Date: TBD |