|
Download Data (XLS File) |
|
||||||||
|
||||||||
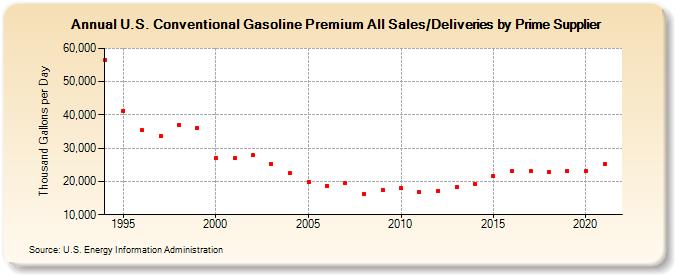
| U.S. Conventional Gasoline Premium All Sales/Deliveries by Prime Supplier (Thousand Gallons per Day) | ||||||||
| Decade | Year-0 | Year-1 | Year-2 | Year-3 | Year-4 | Year-5 | Year-6 | Year-7 | Year-8 | Year-9 |
|---|---|---|---|---|---|---|---|---|---|---|
| 1990's | 56,428.6 | 41,248.2 | 35,346.4 | 33,590.5 | 37,069.7 | 36,127.8 | ||||
| 2000's | 27,049.2 | 26,931.2 | 27,936.6 | 25,253.1 | 22,394.5 | 19,961.0 | 18,754.8 | 19,413.9 | 16,154.5 | 17,509.5 |
| 2010's | 17,938.0 | 16,758.7 | 17,211.0 | 18,276.9 | 19,372.8 | 21,614.6 | 22,999.4 | 23,202.4 | 22,890.7 | 23,155.7 |
| 2020's | 23,039.7 |
| - = No Data Reported; -- = Not Applicable; NA = Not Available; W = Withheld to avoid disclosure of individual company data. |
| Release Date: 6/1/2022 |
| Next Release Date: TBD |