|
Download Data (XLS File) |
|
||||||||
|
||||||||
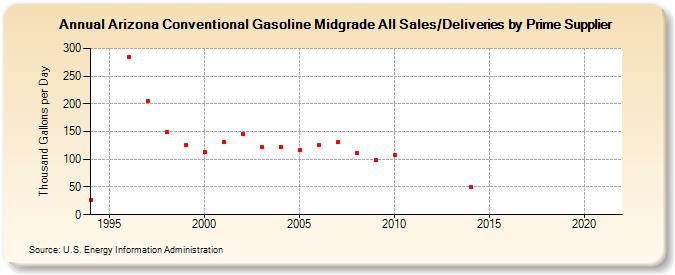
| Arizona Conventional Gasoline Midgrade All Sales/Deliveries by Prime Supplier (Thousand Gallons per Day) | ||||||||
| Decade | Year-0 | Year-1 | Year-2 | Year-3 | Year-4 | Year-5 | Year-6 | Year-7 | Year-8 | Year-9 |
|---|---|---|---|---|---|---|---|---|---|---|
| 1990's | 27.2 | W | 284.8 | 204.6 | 149.3 | 125.9 | ||||
| 2000's | 112.9 | 130.5 | 145.7 | 122.1 | 122.9 | 116.8 | 125.4 | 131.3 | 110.7 | 99.1 |
| 2010's | 108.1 | W | W | W | 50.0 | W | W | W | W | W |
| 2020's | W |
| - = No Data Reported; -- = Not Applicable; NA = Not Available; W = Withheld to avoid disclosure of individual company data. |
| Release Date: 6/1/2022 |
| Next Release Date: TBD |