|
Download Data (XLS File) |
|
||||||||
|
||||||||
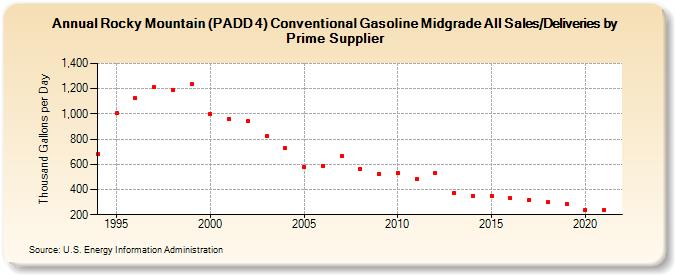
| Rocky Mountain (PADD 4) Conventional Gasoline Midgrade All Sales/Deliveries by Prime Supplier (Thousand Gallons per Day) | ||||||||
| Decade | Year-0 | Year-1 | Year-2 | Year-3 | Year-4 | Year-5 | Year-6 | Year-7 | Year-8 | Year-9 |
|---|---|---|---|---|---|---|---|---|---|---|
| 1990's | 682.9 | 1,004.6 | 1,126.0 | 1,211.6 | 1,192.8 | 1,233.5 | ||||
| 2000's | 1,001.4 | 959.7 | 940.9 | 822.2 | 725.5 | 579.8 | 586.8 | 666.3 | 561.7 | 522.5 |
| 2010's | 529.9 | 479.9 | 529.9 | 374.2 | 350.1 | 346.7 | 333.9 | 319.0 | 297.2 | 285.4 |
| 2020's | 239.5 |
| - = No Data Reported; -- = Not Applicable; NA = Not Available; W = Withheld to avoid disclosure of individual company data. |
| Release Date: 6/1/2022 |
| Next Release Date: TBD |