|
Download Data (XLS File) |
|
||||||||
|
||||||||
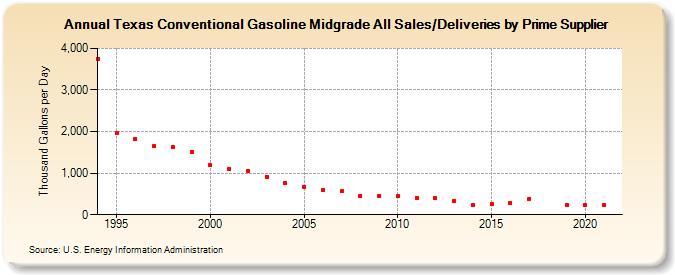
| Texas Conventional Gasoline Midgrade All Sales/Deliveries by Prime Supplier (Thousand Gallons per Day) | ||||||||
| Decade | Year-0 | Year-1 | Year-2 | Year-3 | Year-4 | Year-5 | Year-6 | Year-7 | Year-8 | Year-9 |
|---|---|---|---|---|---|---|---|---|---|---|
| 1990's | 3,744.8 | 1,953.8 | 1,815.5 | 1,641.3 | 1,634.7 | 1,519.4 | ||||
| 2000's | 1,185.0 | 1,095.1 | 1,057.2 | 919.0 | 774.0 | 676.4 | 586.4 | 563.8 | 457.0 | 460.4 |
| 2010's | 447.3 | 405.1 | 393.7 | 335.8 | 230.2 | 254.2 | 290.0 | 385.3 | W | 241.3 |
| 2020's | 227.0 |
| - = No Data Reported; -- = Not Applicable; NA = Not Available; W = Withheld to avoid disclosure of individual company data. |
| Release Date: 6/1/2022 |
| Next Release Date: TBD |