|
Download Data (XLS File) |
|
||||||||
|
||||||||
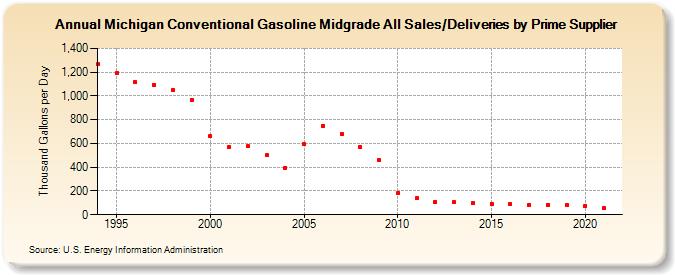
| Michigan Conventional Gasoline Midgrade All Sales/Deliveries by Prime Supplier (Thousand Gallons per Day) | ||||||||
| Decade | Year-0 | Year-1 | Year-2 | Year-3 | Year-4 | Year-5 | Year-6 | Year-7 | Year-8 | Year-9 |
|---|---|---|---|---|---|---|---|---|---|---|
| 1990's | 1,267.0 | 1,189.0 | 1,115.9 | 1,095.6 | 1,047.4 | 967.7 | ||||
| 2000's | 658.7 | 570.7 | 578.1 | 499.9 | 396.0 | 592.1 | 749.6 | 681.3 | 567.3 | 457.9 |
| 2010's | 184.4 | 139.4 | 109.9 | 104.4 | 98.1 | 92.6 | 87.8 | 82.4 | 85.3 | 80.8 |
| 2020's | 77.2 |
| - = No Data Reported; -- = Not Applicable; NA = Not Available; W = Withheld to avoid disclosure of individual company data. |
| Release Date: 6/1/2022 |
| Next Release Date: TBD |