|
Download Data (XLS File) |
|
||||||||
|
||||||||
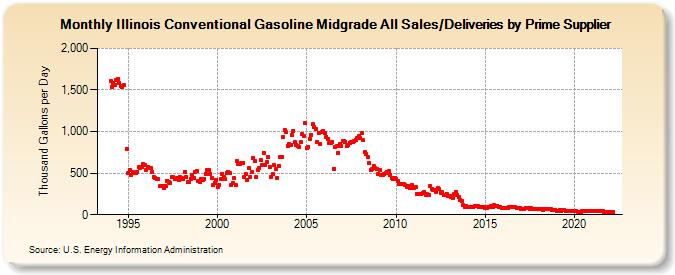
| Illinois Conventional Gasoline Midgrade All Sales/Deliveries by Prime Supplier (Thousand Gallons per Day) | ||||||||
| Year | Jan | Feb | Mar | Apr | May | Jun | Jul | Aug | Sep | Oct | Nov | Dec |
|---|---|---|---|---|---|---|---|---|---|---|---|---|
| 1993 | NA | NA | NA | |||||||||
| 1994 | 1,612.0 | 1,540.8 | 1,579.4 | 1,559.8 | 1,615.5 | 1,636.1 | 1,588.0 | 1,543.3 | 1,533.2 | 1,557.5 | W | 791.5 |
| 1995 | 504.7 | 534.3 | 480.4 | 513.1 | 502.1 | 504.8 | 516.4 | 574.8 | 562.6 | 579.6 | 605.6 | 599.5 |
| 1996 | 542.0 | 575.4 | 565.8 | 558.0 | 513.1 | 452.1 | 447.2 | 432.9 | 425.8 | 340.0 | 344.1 | 345.5 |
| 1997 | 322.7 | 343.3 | 411.3 | 398.1 | 383.5 | 450.7 | 449.9 | 427.9 | 427.8 | 443.2 | 411.5 | 452.7 |
| 1998 | 436.9 | 427.0 | 513.2 | 452.8 | 388.7 | 390.5 | 432.6 | 477.5 | 443.5 | 517.6 | 525.1 | 400.2 |
| 1999 | 391.6 | 434.8 | 420.6 | 431.8 | 487.6 | 539.8 | 540.6 | 493.2 | 444.7 | 360.5 | 376.8 | 422.9 |
| 2000 | 336.3 | 358.4 | 425.9 | 493.5 | 447.6 | 424.5 | 499.8 | 513.9 | 497.5 | 358.9 | 381.3 | 438.5 |
| 2001 | 353.9 | 640.9 | 610.5 | 613.4 | 616.6 | 626.8 | 454.3 | 489.3 | 414.5 | 558.1 | 456.3 | 514.3 |
| 2002 | 685.0 | 644.2 | 452.3 | 535.7 | 566.3 | 653.8 | 594.5 | 748.1 | 602.4 | 629.5 | 696.5 | 572.8 |
| 2003 | 458.8 | 492.6 | 592.0 | 544.6 | 445.3 | 586.3 | 688.8 | 700.0 | 935.9 | 1,016.0 | 990.8 | 830.9 |
| 2004 | 848.6 | 835.8 | 964.3 | 1,009.9 | 869.3 | 841.7 | 821.6 | 816.9 | 868.5 | 967.4 | 944.6 | 1,099.0 |
| 2005 | 804.9 | 818.3 | 909.3 | 964.3 | 1,085.3 | 1,048.9 | 1,029.9 | 879.5 | 988.0 | 853.3 | 994.7 | 1,006.3 |
| 2006 | 978.7 | 939.9 | 913.5 | 859.4 | 858.7 | 877.9 | 555.6 | 814.5 | 822.0 | 744.2 | 845.3 | 824.4 |
| 2007 | 891.4 | 890.6 | 878.8 | 822.2 | 844.0 | 862.9 | 874.0 | 875.8 | 885.3 | 893.0 | 920.7 | 947.4 |
| 2008 | 924.3 | 978.4 | 893.5 | 750.6 | 731.3 | 690.0 | 617.5 | 537.0 | 545.5 | 581.5 | 556.2 | 545.0 |
| 2009 | 486.7 | 541.1 | 476.3 | 475.3 | 484.2 | 501.0 | 514.5 | 522.5 | 474.1 | 446.3 | 426.1 | 438.6 |
| 2010 | 429.9 | 405.1 | 365.3 | 365.7 | 370.6 | 374.4 | 355.6 | 331.1 | 351.1 | 320.4 | 325.8 | 357.8 |
| 2011 | 315.4 | 338.3 | 254.5 | 244.5 | 252.3 | 254.8 | 266.5 | 270.6 | 240.2 | 243.4 | 241.7 | 341.2 |
| 2012 | 313.8 | 302.6 | 297.6 | 277.1 | 326.7 | 305.0 | 266.4 | 269.2 | 231.6 | 233.5 | 254.5 | 226.1 |
| 2013 | 227.3 | 207.4 | 201.5 | 244.2 | 271.7 | 242.5 | 213.2 | 181.6 | 167.2 | 112.5 | 97.5 | 109.4 |
| 2014 | 91.7 | 91.3 | 93.0 | 94.6 | 94.5 | 99.0 | 105.9 | 100.7 | 95.7 | 91.6 | 93.3 | 94.7 |
| 2015 | 86.0 | 84.4 | 97.9 | 96.9 | 99.2 | 97.4 | 115.1 | 110.4 | 110.8 | 93.7 | 90.9 | 84.9 |
| 2016 | 82.7 | 79.8 | 80.4 | 85.3 | 87.8 | 88.6 | 91.5 | 86.8 | 88.5 | 82.3 | 82.3 | 77.9 |
| 2017 | 67.6 | 68.1 | 74.5 | 75.9 | 79.6 | 80.3 | 73.2 | 75.9 | 69.9 | 69.4 | 68.0 | 69.4 |
| 2018 | 65.2 | 64.6 | 67.3 | 62.3 | 71.9 | 68.8 | 67.2 | 64.5 | 63.6 | 58.9 | 61.5 | 58.1 |
| 2019 | 48.9 | 49.7 | 54.4 | 48.3 | 51.3 | 56.7 | 45.0 | 46.6 | 47.7 | 48.9 | 47.2 | 47.1 |
| 2020 | 43.3 | 42.1 | 38.4 | 29.6 | 36.4 | 45.2 | 49.1 | 48.8 | 46.8 | 46.6 | 42.3 | 39.3 |
| 2021 | 39.3 | 40.1 | 42.0 | 42.6 | 44.3 | 43.3 | 44.8 | 42.3 | 38.0 | 36.2 | 35.2 | 34.9 |
| 2022 | 35.6 | 35.9 | 28.4 | |||||||||
| - = No Data Reported; -- = Not Applicable; NA = Not Available; W = Withheld to avoid disclosure of individual company data. |
| Release Date: 5/19/2022 |
| Next Release Date: TBD |