|
Download Data (XLS File) |
|
||||||||
|
||||||||
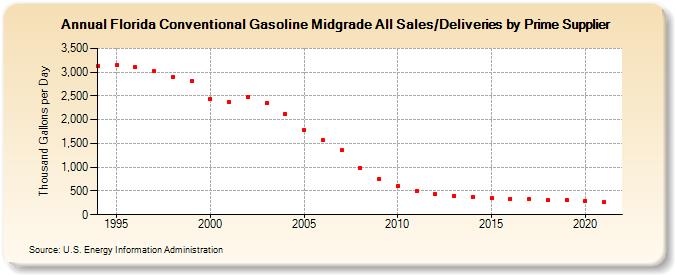
| Florida Conventional Gasoline Midgrade All Sales/Deliveries by Prime Supplier (Thousand Gallons per Day) | ||||||||
| Decade | Year-0 | Year-1 | Year-2 | Year-3 | Year-4 | Year-5 | Year-6 | Year-7 | Year-8 | Year-9 |
|---|---|---|---|---|---|---|---|---|---|---|
| 1990's | 3,120.3 | 3,146.4 | 3,100.7 | 3,015.4 | 2,899.5 | 2,816.1 | ||||
| 2000's | 2,436.1 | 2,363.5 | 2,470.1 | 2,354.6 | 2,115.4 | 1,791.9 | 1,566.8 | 1,355.2 | 973.0 | 761.7 |
| 2010's | 607.2 | 490.1 | 427.2 | 402.8 | 371.2 | 352.3 | 340.9 | 330.1 | 308.0 | 310.7 |
| 2020's | 293.8 |
| - = No Data Reported; -- = Not Applicable; NA = Not Available; W = Withheld to avoid disclosure of individual company data. |
| Release Date: 6/1/2022 |
| Next Release Date: TBD |