|
Download Data (XLS File) |
|
||||||||
|
||||||||
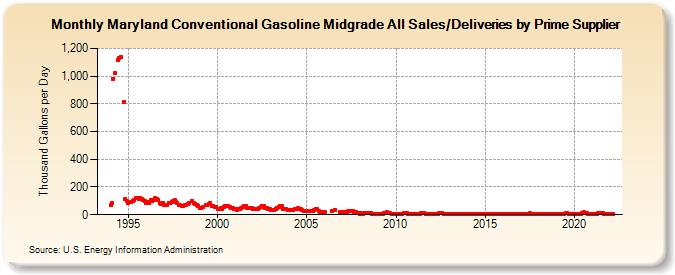
| Maryland Conventional Gasoline Midgrade All Sales/Deliveries by Prime Supplier (Thousand Gallons per Day) | ||||||||
| Year | Jan | Feb | Mar | Apr | May | Jun | Jul | Aug | Sep | Oct | Nov | Dec |
|---|---|---|---|---|---|---|---|---|---|---|---|---|
| 1993 | NA | NA | NA | |||||||||
| 1994 | 71.2 | 82.4 | 977.8 | 1,019.5 | W | 1,118.3 | 1,130.3 | 1,139.1 | W | 814.4 | 114.8 | 96.1 |
| 1995 | 82.3 | W | 93.3 | 99.0 | 104.5 | 118.4 | 121.8 | 116.9 | 119.4 | 111.1 | 106.2 | 96.8 |
| 1996 | 82.1 | 94.8 | 82.1 | 103.6 | 100.1 | 105.0 | 117.8 | 115.3 | 102.7 | 87.5 | 78.4 | 83.8 |
| 1997 | 71.4 | 70.9 | 70.0 | 88.1 | 85.0 | 92.5 | 102.3 | 103.3 | 91.8 | 81.6 | 68.9 | 69.5 |
| 1998 | 66.2 | 65.6 | 73.4 | 72.8 | 79.3 | 83.9 | W | 99.3 | 82.5 | 78.3 | 72.0 | 62.5 |
| 1999 | 48.8 | 50.9 | 54.0 | W | 70.5 | 71.8 | 79.7 | 83.2 | 66.3 | 62.2 | 57.3 | 54.3 |
| 2000 | 38.2 | 44.8 | 45.1 | 43.7 | 57.4 | 60.5 | 64.6 | 62.0 | 53.5 | 50.3 | 47.5 | 42.6 |
| 2001 | 39.2 | 37.3 | 44.5 | 44.8 | 48.6 | 55.5 | 62.4 | 64.2 | 50.9 | 51.0 | 48.5 | 46.3 |
| 2002 | 40.5 | 43.9 | 43.1 | 43.5 | 50.3 | 55.5 | 66.0 | 66.0 | 45.6 | 45.9 | 43.2 | 41.9 |
| 2003 | 36.3 | 33.8 | 37.0 | 42.9 | 45.9 | 53.6 | 63.1 | 60.3 | 44.7 | 43.7 | 39.1 | 36.7 |
| 2004 | 30.8 | 35.6 | 33.6 | 34.6 | 42.0 | 38.0 | 46.8 | 42.4 | 37.9 | 31.1 | 28.7 | 25.7 |
| 2005 | 24.0 | 26.1 | 25.2 | 26.7 | 30.0 | 37.1 | 41.5 | 38.8 | 28.1 | 22.5 | 21.2 | 19.9 |
| 2006 | 16.7 | W | W | W | W | 28.5 | W | 35.9 | W | W | 18.8 | W |
| 2007 | 19.5 | 16.4 | 18.6 | 19.5 | 24.6 | 24.8 | 28.2 | 27.8 | 21.1 | 17.0 | 13.4 | 9.3 |
| 2008 | 8.3 | 9.0 | 6.9 | 10.0 | 13.9 | 13.1 | 14.9 | 14.6 | 8.7 | 7.2 | 6.5 | 5.6 |
| 2009 | 6.0 | 6.1 | 6.9 | 7.6 | 11.2 | 11.6 | 17.5 | 15.8 | 9.5 | 5.8 | 5.5 | 6.0 |
| 2010 | 4.4 | 5.1 | 5.6 | 7.5 | 7.3 | 8.9 | 10.3 | 9.0 | 6.2 | 4.7 | 4.1 | 5.3 |
| 2011 | 4.1 | 3.6 | 5.1 | 5.6 | 7.1 | 9.4 | 10.9 | 10.7 | 5.9 | 4.5 | 4.6 | 3.6 |
| 2012 | 3.3 | 3.6 | 4.3 | 5.9 | 7.6 | 9.3 | 11.8 | 8.9 | 6.5 | 5.0 | 4.0 | 3.1 |
| 2013 | 3.5 | 3.3 | 4.5 | 4.7 | 6.5 | 7.5 | 8.5 | 7.6 | 6.6 | 4.6 | 3.9 | 3.3 |
| 2014 | 3.1 | 3.7 | 4.3 | 5.1 | 6.2 | 6.1 | 6.4 | 5.6 | 4.8 | 4.4 | 3.8 | 3.3 |
| 2015 | 3.3 | 3.3 | 3.8 | 5.2 | 5.9 | 6.4 | 8.4 | 7.9 | 4.8 | 3.6 | 3.7 | 3.5 |
| 2016 | 3.1 | 3.0 | 3.2 | 4.7 | 5.1 | 6.5 | 6.0 | 6.2 | 8.2 | 6.6 | 4.3 | 3.7 |
| 2017 | 3.9 | 3.8 | 4.6 | 4.4 | 5.1 | 8.3 | 9.0 | 6.7 | 6.2 | 5.5 | 4.3 | 4.8 |
| 2018 | 3.9 | 4.4 | 3.7 | 4.5 | 6.7 | 6.9 | 6.7 | 6.6 | 4.6 | 4.4 | 4.0 | 3.1 |
| 2019 | 3.7 | 3.0 | 3.2 | 4.7 | 7.2 | 8.5 | 10.2 | 11.6 | 7.3 | 4.7 | 3.7 | 3.0 |
| 2020 | 3.0 | 2.8 | 3.4 | 3.1 | 5.3 | 10.9 | 16.7 | 15.6 | 10.4 | 6.2 | 4.2 | 3.9 |
| 2021 | 3.3 | 3.4 | 4.0 | 6.4 | 9.8 | 10.3 | 15.7 | 14.5 | 7.6 | 5.6 | 3.4 | 3.8 |
| 2022 | 2.6 | 3.0 | 2.6 | |||||||||
| - = No Data Reported; -- = Not Applicable; NA = Not Available; W = Withheld to avoid disclosure of individual company data. |
| Release Date: 5/19/2022 |
| Next Release Date: TBD |