|
Download Data (XLS File) |
|
||||||||
|
||||||||
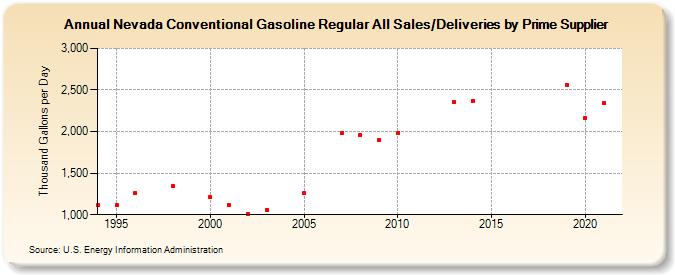
| Nevada Conventional Gasoline Regular All Sales/Deliveries by Prime Supplier (Thousand Gallons per Day) | ||||||||
| Decade | Year-0 | Year-1 | Year-2 | Year-3 | Year-4 | Year-5 | Year-6 | Year-7 | Year-8 | Year-9 |
|---|---|---|---|---|---|---|---|---|---|---|
| 1990's | 1,111.7 | 1,117.3 | 1,260.0 | W | 1,347.0 | W | ||||
| 2000's | 1,207.7 | 1,119.4 | 1,008.2 | 1,058.4 | W | 1,256.5 | W | 1,977.3 | 1,960.1 | 1,904.2 |
| 2010's | 1,983.3 | W | W | 2,356.8 | 2,369.3 | W | W | W | W | 2,560.4 |
| 2020's | 2,165.8 |
| - = No Data Reported; -- = Not Applicable; NA = Not Available; W = Withheld to avoid disclosure of individual company data. |
| Release Date: 6/1/2022 |
| Next Release Date: TBD |