|
Download Data (XLS File) |
|
||||||||
|
||||||||
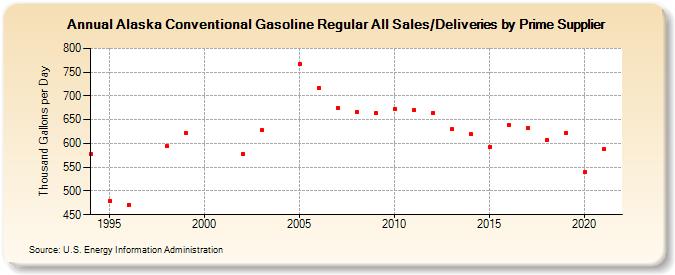
| Alaska Conventional Gasoline Regular All Sales/Deliveries by Prime Supplier (Thousand Gallons per Day) | ||||||||
| Decade | Year-0 | Year-1 | Year-2 | Year-3 | Year-4 | Year-5 | Year-6 | Year-7 | Year-8 | Year-9 |
|---|---|---|---|---|---|---|---|---|---|---|
| 1990's | 577.2 | 479.0 | 471.0 | W | 593.8 | 622.4 | ||||
| 2000's | W | W | 578.4 | 628.7 | W | 767.4 | 717.5 | 675.6 | 666.2 | 663.0 |
| 2010's | 672.9 | 670.1 | 664.8 | 629.8 | 619.6 | 593.1 | 638.8 | 632.2 | 608.1 | 622.4 |
| 2020's | 539.3 |
| - = No Data Reported; -- = Not Applicable; NA = Not Available; W = Withheld to avoid disclosure of individual company data. |
| Release Date: 6/1/2022 |
| Next Release Date: TBD |