|
Download Data (XLS File) |
|
||||||||
|
||||||||
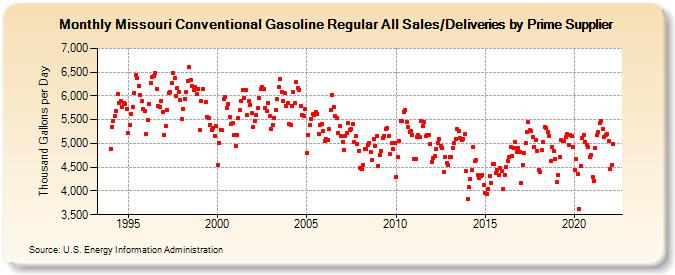
| Missouri Conventional Gasoline Regular All Sales/Deliveries by Prime Supplier (Thousand Gallons per Day) | ||||||||
| Year | Jan | Feb | Mar | Apr | May | Jun | Jul | Aug | Sep | Oct | Nov | Dec |
|---|---|---|---|---|---|---|---|---|---|---|---|---|
| 1993 | NA | NA | NA | |||||||||
| 1994 | 4,892.3 | 5,345.9 | 5,482.5 | 5,575.4 | 5,688.8 | 6,039.1 | 5,847.4 | 5,893.0 | 5,775.8 | 5,857.1 | 5,828.1 | 5,728.8 |
| 1995 | 5,211.2 | 5,394.4 | 5,617.8 | 5,774.9 | 6,071.7 | 6,434.7 | 6,367.5 | 6,212.3 | 6,011.3 | 5,886.0 | 5,718.4 | 5,679.4 |
| 1996 | 5,196.2 | 5,496.8 | 5,828.1 | 6,277.7 | 6,398.5 | 6,417.0 | 6,491.7 | 6,149.8 | 5,783.6 | 5,776.3 | 5,886.8 | 5,663.6 |
| 1997 | 5,174.2 | 5,366.0 | 5,700.8 | 6,055.8 | 6,082.8 | 6,268.9 | 6,483.5 | 6,372.6 | 6,007.9 | 6,159.6 | 6,082.7 | 5,913.5 |
| 1998 | 5,511.1 | 5,729.9 | 5,943.3 | 6,082.9 | 6,317.2 | 6,609.0 | 6,342.9 | 6,212.1 | 6,132.4 | 6,191.8 | 6,035.5 | 6,151.0 |
| 1999 | 5,286.5 | 5,884.5 | 6,153.4 | W | 5,879.9 | 5,562.7 | 5,537.8 | 5,393.4 | 5,273.6 | 5,319.2 | 5,164.3 | 5,362.1 |
| 2000 | 4,542.5 | 5,009.1 | 5,290.0 | 5,273.0 | 5,933.3 | 5,973.9 | 5,745.0 | 5,830.9 | 5,556.8 | 5,416.4 | 5,420.0 | 5,187.0 |
| 2001 | 4,939.5 | 5,184.9 | 5,539.7 | 5,713.1 | 5,889.9 | 6,117.5 | 5,966.1 | 6,126.0 | 5,596.1 | 5,892.5 | 5,819.1 | 5,633.5 |
| 2002 | 5,344.0 | 5,477.2 | 5,601.2 | 5,745.4 | 5,954.8 | 6,135.5 | 6,177.5 | 6,148.5 | 5,740.4 | 5,690.6 | 5,856.7 | 5,570.2 |
| 2003 | 5,294.6 | 5,378.4 | 5,540.1 | 5,709.6 | 5,925.7 | 6,181.7 | 6,347.0 | 6,086.1 | 5,891.9 | 6,064.3 | 5,786.5 | 5,854.3 |
| 2004 | 5,419.3 | 5,392.0 | 5,795.4 | 6,072.5 | 5,843.0 | 6,289.1 | 6,175.9 | 6,133.3 | 5,785.0 | 5,602.2 | 5,572.8 | 5,722.2 |
| 2005 | 4,796.5 | 5,178.7 | 5,379.4 | 5,515.0 | 5,609.0 | 5,599.8 | 5,671.9 | 5,628.2 | 5,201.5 | 5,397.5 | 5,412.2 | 5,271.7 |
| 2006 | 5,047.5 | 5,096.3 | 5,071.5 | 5,299.8 | 5,693.6 | 6,025.8 | 5,766.8 | 5,577.4 | 5,542.5 | 5,227.2 | 5,372.1 | 5,150.8 |
| 2007 | 5,039.7 | 4,866.5 | 5,156.5 | 5,218.7 | 5,422.7 | 5,282.2 | 5,295.7 | 5,402.3 | 5,026.5 | 5,153.9 | 4,988.2 | 4,848.8 |
| 2008 | 4,491.3 | 4,456.7 | 4,551.4 | 4,889.8 | 4,885.8 | 4,975.1 | 5,014.4 | 4,822.5 | 4,659.2 | 5,084.7 | 4,943.2 | 5,160.1 |
| 2009 | 4,533.2 | 4,764.1 | 4,847.7 | 5,121.9 | 5,146.0 | 5,299.3 | 5,320.2 | 5,159.3 | 4,767.3 | 5,002.2 | 4,875.3 | 5,007.6 |
| 2010 | 4,301.3 | 4,709.6 | 5,053.8 | 5,481.1 | 5,467.5 | 5,665.9 | 5,701.3 | 5,448.3 | 5,340.8 | 5,247.1 | 5,259.5 | 5,181.1 |
| 2011 | 4,676.5 | 4,670.6 | 5,136.0 | 5,168.9 | 5,126.6 | 5,469.8 | 5,369.0 | 5,441.0 | 5,146.4 | 5,184.3 | 5,170.6 | 4,994.2 |
| 2012 | 4,609.7 | 4,689.9 | 4,745.6 | 4,891.1 | 5,015.2 | 5,089.3 | 4,955.1 | 4,899.7 | 4,389.9 | 4,718.7 | 4,589.7 | 4,536.9 |
| 2013 | 4,709.6 | 4,714.2 | 4,904.6 | 5,014.8 | 5,101.7 | 5,310.2 | 5,271.1 | 5,107.0 | 5,073.1 | 5,094.9 | 5,195.9 | 4,412.8 |
| 2014 | 3,828.9 | 4,081.2 | 4,257.0 | 4,445.3 | 4,919.7 | 4,622.8 | 4,644.0 | 4,327.3 | 4,266.7 | 4,307.6 | 4,326.7 | 4,134.5 |
| 2015 | 3,964.2 | 3,933.8 | 4,046.3 | 4,319.7 | 4,177.6 | 4,571.5 | 4,557.3 | 4,379.4 | 4,444.7 | 4,335.4 | 4,475.8 | 4,413.6 |
| 2016 | 4,048.5 | 4,326.6 | 4,495.0 | 4,638.2 | 4,704.2 | 4,921.0 | 4,745.6 | 4,894.7 | 5,027.8 | 4,815.9 | 4,906.9 | 4,818.6 |
| 2017 | 4,169.7 | 4,541.1 | 4,795.8 | 5,007.6 | 5,234.6 | 5,446.7 | 5,273.5 | 5,263.0 | 5,126.9 | 4,924.6 | 5,062.7 | 4,849.3 |
| 2018 | 4,438.2 | 4,397.2 | 4,851.6 | 5,023.4 | 5,341.8 | 5,334.7 | 5,231.6 | 5,148.4 | 4,637.5 | 4,929.8 | 4,840.6 | 4,682.0 |
| 2019 | 4,181.6 | 4,332.5 | 4,712.0 | 5,062.4 | 5,045.7 | 5,045.5 | 5,142.9 | 5,201.6 | 4,976.5 | 5,174.6 | 5,146.6 | 4,927.3 |
| 2020 | 4,438.8 | 4,668.6 | 4,362.9 | 3,625.9 | 4,518.3 | 5,124.5 | 5,177.6 | 5,038.2 | 4,972.8 | 4,931.2 | 4,718.5 | 4,763.0 |
| 2021 | 4,294.9 | 4,213.9 | 4,913.0 | 5,171.1 | 5,231.7 | 5,421.8 | 5,479.5 | 5,305.0 | 5,144.5 | 5,176.4 | 5,208.4 | 5,054.9 |
| 2022 | 4,459.0 | 4,550.0 | 4,987.1 | |||||||||
| - = No Data Reported; -- = Not Applicable; NA = Not Available; W = Withheld to avoid disclosure of individual company data. |
| Release Date: 5/19/2022 |
| Next Release Date: TBD |