|
Download Data (XLS File) |
|
||||||||
|
||||||||
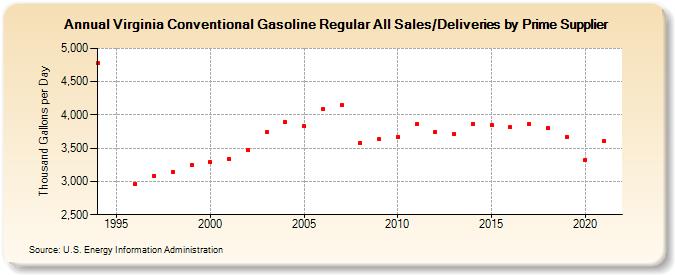
| Virginia Conventional Gasoline Regular All Sales/Deliveries by Prime Supplier (Thousand Gallons per Day) | ||||||||
| Decade | Year-0 | Year-1 | Year-2 | Year-3 | Year-4 | Year-5 | Year-6 | Year-7 | Year-8 | Year-9 |
|---|---|---|---|---|---|---|---|---|---|---|
| 1990's | 4,774.3 | W | 2,959.4 | 3,087.6 | 3,146.9 | 3,239.8 | ||||
| 2000's | 3,289.3 | 3,338.7 | 3,468.0 | 3,736.3 | 3,890.4 | 3,826.9 | 4,083.3 | 4,151.6 | 3,580.9 | 3,632.1 |
| 2010's | 3,669.3 | 3,857.4 | 3,748.5 | 3,714.2 | 3,871.0 | 3,847.6 | 3,814.3 | 3,860.9 | 3,802.5 | 3,674.8 |
| 2020's | 3,323.9 |
| - = No Data Reported; -- = Not Applicable; NA = Not Available; W = Withheld to avoid disclosure of individual company data. |
| Release Date: 6/1/2022 |
| Next Release Date: TBD |