|
Download Data (XLS File) |
|
||||||||
|
||||||||
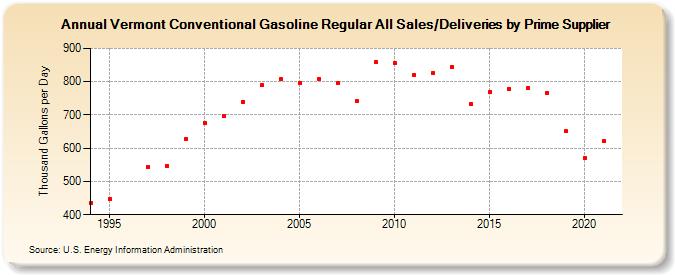
| Vermont Conventional Gasoline Regular All Sales/Deliveries by Prime Supplier (Thousand Gallons per Day) | ||||||||
| Decade | Year-0 | Year-1 | Year-2 | Year-3 | Year-4 | Year-5 | Year-6 | Year-7 | Year-8 | Year-9 |
|---|---|---|---|---|---|---|---|---|---|---|
| 1990's | 435.3 | 447.3 | W | 544.9 | 547.6 | 627.9 | ||||
| 2000's | 676.3 | 696.8 | 739.0 | 789.9 | 807.6 | 796.2 | 809.3 | 797.1 | 741.8 | 858.6 |
| 2010's | 856.6 | 820.3 | 826.6 | 844.3 | 733.0 | 769.9 | 778.5 | 782.3 | 767.3 | 650.6 |
| 2020's | 571.3 |
| - = No Data Reported; -- = Not Applicable; NA = Not Available; W = Withheld to avoid disclosure of individual company data. |
| Release Date: 6/1/2022 |
| Next Release Date: TBD |