|
Download Data (XLS File) |
|
||||||||
|
||||||||
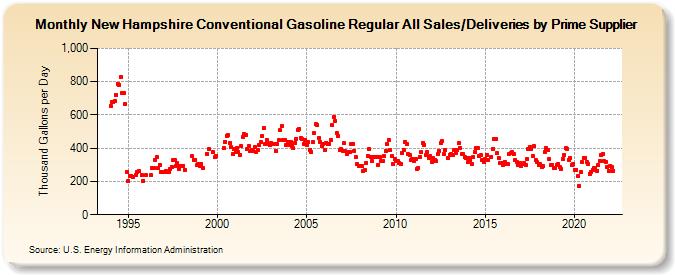
| New Hampshire Conventional Gasoline Regular All Sales/Deliveries by Prime Supplier (Thousand Gallons per Day) | ||||||||
| Year | Jan | Feb | Mar | Apr | May | Jun | Jul | Aug | Sep | Oct | Nov | Dec |
|---|---|---|---|---|---|---|---|---|---|---|---|---|
| 1993 | NA | NA | NA | |||||||||
| 1994 | 652.3 | 679.6 | 675.1 | 685.2 | 722.2 | 788.1 | 779.5 | 826.5 | 730.2 | 732.7 | 665.1 | 256.3 |
| 1995 | 203.6 | 233.0 | 233.3 | 223.9 | W | 238.9 | 254.7 | 262.3 | W | 235.8 | 205.5 | W |
| 1996 | 237.5 | W | W | 235.8 | 281.9 | 282.6 | 329.0 | 346.6 | 280.2 | 300.1 | 259.3 | 257.4 |
| 1997 | 256.1 | 263.3 | 259.0 | 254.2 | 276.0 | 287.7 | 327.1 | 331.3 | 292.9 | 310.7 | 275.0 | 291.6 |
| 1998 | W | 293.4 | 271.5 | W | W | W | W | 351.1 | 331.0 | 330.7 | 296.6 | 306.5 |
| 1999 | 294.4 | 305.3 | 281.5 | W | W | 365.2 | 393.6 | W | W | 376.4 | 345.3 | 353.0 |
| 2000 | W | W | W | W | 399.8 | 439.9 | 475.1 | 477.0 | 429.3 | 406.7 | 364.8 | 392.8 |
| 2001 | 378.1 | 400.5 | 376.4 | 360.0 | 413.0 | 469.4 | 487.1 | 481.7 | 395.4 | 412.5 | 383.2 | 387.9 |
| 2002 | 383.9 | 408.3 | 378.1 | 386.8 | 418.6 | 434.7 | 474.7 | 520.5 | 424.0 | 451.4 | 422.5 | 416.4 |
| 2003 | 430.1 | 423.9 | 426.2 | 385.2 | 423.8 | 447.6 | 507.3 | 533.8 | 449.8 | 450.0 | 417.8 | 435.2 |
| 2004 | 421.4 | 439.8 | 415.6 | 400.7 | 433.4 | 456.7 | 510.9 | 516.3 | 462.7 | 453.1 | 425.4 | 449.0 |
| 2005 | 420.8 | 434.2 | 390.6 | 378.0 | 434.6 | 489.2 | 543.1 | 537.0 | 460.4 | 434.8 | 411.3 | 426.0 |
| 2006 | 389.5 | 433.6 | 424.2 | 428.0 | 448.3 | 537.8 | 588.9 | 565.2 | 489.5 | 475.4 | 387.0 | 394.8 |
| 2007 | 384.4 | 428.7 | 380.8 | 366.0 | 378.0 | 377.8 | 427.7 | 426.8 | 384.3 | 344.6 | 304.2 | 295.7 |
| 2008 | 291.8 | 290.4 | 265.8 | 268.9 | 313.5 | 354.9 | 393.7 | 349.6 | 320.8 | 346.2 | 345.3 | 348.6 |
| 2009 | 300.5 | 345.5 | 321.7 | 322.4 | 354.1 | 380.1 | 423.2 | 449.1 | 386.2 | 352.0 | 305.7 | 333.1 |
| 2010 | 325.5 | 322.9 | 313.8 | 304.3 | 373.8 | 388.2 | 439.0 | 425.8 | 366.8 | 358.9 | 327.1 | 337.4 |
| 2011 | 323.7 | 333.6 | 275.8 | 281.3 | 350.0 | 375.9 | 433.8 | 421.1 | 360.9 | 375.3 | 342.9 | 353.0 |
| 2012 | 319.5 | 338.2 | 329.8 | 322.1 | 363.7 | 385.4 | 431.9 | 441.1 | 366.2 | 386.6 | W | 340.9 |
| 2013 | 360.7 | 366.5 | 359.1 | 387.7 | 371.9 | 387.9 | 428.7 | 403.0 | 365.1 | 363.5 | 346.8 | 342.6 |
| 2014 | 314.8 | 341.8 | 328.0 | 303.6 | 345.3 | 377.3 | 401.5 | 399.4 | 353.8 | 358.9 | 330.0 | 319.5 |
| 2015 | 334.2 | 360.7 | 326.8 | W | 349.1 | 397.6 | 456.5 | 452.5 | 370.7 | 341.5 | 308.8 | 309.4 |
| 2016 | 301.4 | 319.6 | 304.3 | 305.7 | 366.9 | 368.3 | 376.6 | 362.8 | 327.6 | 315.1 | 301.0 | 308.7 |
| 2017 | 294.7 | 302.3 | 308.8 | 299.2 | 336.2 | 392.5 | 405.9 | 393.6 | 355.3 | 411.4 | 327.0 | 314.2 |
| 2018 | 299.3 | 302.3 | 289.1 | 291.8 | 379.4 | 399.9 | 389.2 | 334.4 | 296.3 | 300.5 | 278.1 | 282.4 |
| 2019 | 300.1 | 306.4 | 285.5 | 277.3 | 336.2 | 359.4 | 400.4 | 397.0 | 331.6 | 340.2 | 300.9 | 302.8 |
| 2020 | 270.7 | 269.1 | 230.4 | 173.6 | 254.0 | 315.8 | 341.1 | 342.6 | 319.5 | 304.0 | 247.4 | 258.7 |
| 2021 | 270.2 | 282.3 | 281.8 | 265.3 | 296.8 | 324.2 | 357.2 | 368.0 | 320.1 | 319.3 | 286.8 | 265.5 |
| 2022 | 295.2 | 285.0 | 262.5 | |||||||||
| - = No Data Reported; -- = Not Applicable; NA = Not Available; W = Withheld to avoid disclosure of individual company data. |
| Release Date: 5/19/2022 |
| Next Release Date: TBD |