|
Download Data (XLS File) |
|
||||||||
|
||||||||
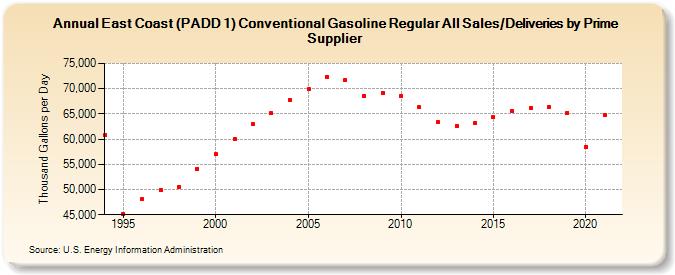
| East Coast (PADD 1) Conventional Gasoline Regular All Sales/Deliveries by Prime Supplier (Thousand Gallons per Day) | ||||||||
| Decade | Year-0 | Year-1 | Year-2 | Year-3 | Year-4 | Year-5 | Year-6 | Year-7 | Year-8 | Year-9 |
|---|---|---|---|---|---|---|---|---|---|---|
| 1990's | 60,804.8 | 45,089.8 | 48,076.5 | 49,886.9 | 50,582.2 | 54,047.3 | ||||
| 2000's | 57,027.1 | 60,097.9 | 62,935.2 | 65,174.5 | 67,830.1 | 69,885.5 | 72,319.6 | 71,685.5 | 68,608.0 | 69,239.3 |
| 2010's | 68,550.5 | 66,313.7 | 63,384.2 | 62,604.6 | 63,255.4 | 64,343.3 | 65,520.5 | 66,175.0 | 66,436.2 | 65,242.3 |
| 2020's | 58,505.0 |
| - = No Data Reported; -- = Not Applicable; NA = Not Available; W = Withheld to avoid disclosure of individual company data. |
| Release Date: 6/1/2022 |
| Next Release Date: TBD |