|
Download Data (XLS File) |
|
||||||||
|
||||||||
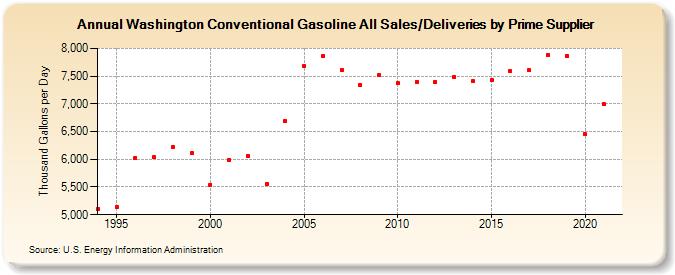
| Washington Conventional Gasoline All Sales/Deliveries by Prime Supplier (Thousand Gallons per Day) | ||||||||
| Decade | Year-0 | Year-1 | Year-2 | Year-3 | Year-4 | Year-5 | Year-6 | Year-7 | Year-8 | Year-9 |
|---|---|---|---|---|---|---|---|---|---|---|
| 1990's | 5,103.3 | 5,135.5 | 6,026.1 | 6,033.1 | 6,223.2 | 6,109.6 | ||||
| 2000's | 5,543.0 | 5,989.6 | 6,067.8 | 5,559.0 | 6,689.9 | 7,687.2 | 7,860.1 | 7,617.5 | 7,341.5 | 7,515.8 |
| 2010's | 7,367.4 | 7,396.4 | 7,399.2 | 7,485.7 | 7,408.3 | 7,427.7 | 7,584.8 | 7,603.4 | 7,878.0 | 7,867.4 |
| 2020's | 6,449.9 |
| - = No Data Reported; -- = Not Applicable; NA = Not Available; W = Withheld to avoid disclosure of individual company data. |
| Release Date: 6/1/2022 |
| Next Release Date: TBD |