|
Download Data (XLS File) |
|
||||||||
|
||||||||
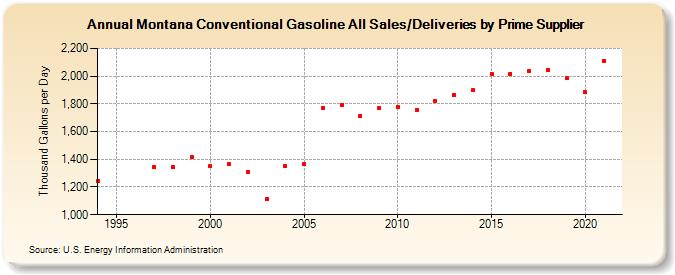
| Montana Conventional Gasoline All Sales/Deliveries by Prime Supplier (Thousand Gallons per Day) | ||||||||
| Decade | Year-0 | Year-1 | Year-2 | Year-3 | Year-4 | Year-5 | Year-6 | Year-7 | Year-8 | Year-9 |
|---|---|---|---|---|---|---|---|---|---|---|
| 1990's | 1,246.1 | W | W | 1,342.9 | 1,342.8 | 1,418.7 | ||||
| 2000's | 1,351.5 | 1,362.5 | 1,310.3 | 1,112.4 | 1,348.3 | 1,365.5 | 1,768.8 | 1,789.8 | 1,714.2 | 1,766.9 |
| 2010's | 1,776.2 | 1,759.1 | 1,820.3 | 1,864.4 | 1,896.6 | 2,017.0 | 2,017.5 | 2,038.7 | 2,045.5 | 1,983.7 |
| 2020's | 1,882.4 |
| - = No Data Reported; -- = Not Applicable; NA = Not Available; W = Withheld to avoid disclosure of individual company data. |
| Release Date: 6/1/2022 |
| Next Release Date: TBD |