|
Download Data (XLS File) |
|
||||||||
|
||||||||
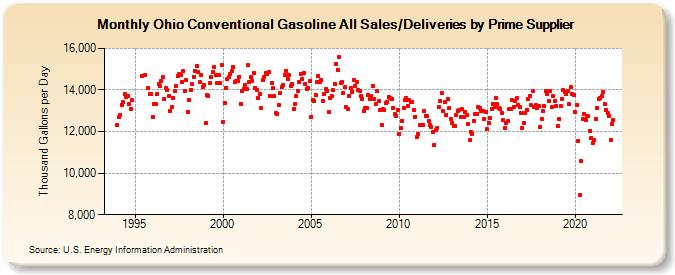
| Ohio Conventional Gasoline All Sales/Deliveries by Prime Supplier (Thousand Gallons per Day) | ||||||||
| Year | Jan | Feb | Mar | Apr | May | Jun | Jul | Aug | Sep | Oct | Nov | Dec |
|---|---|---|---|---|---|---|---|---|---|---|---|---|
| 1993 | NA | NA | NA | |||||||||
| 1994 | 12,306.1 | 12,692.3 | 12,812.1 | 13,285.3 | 13,402.9 | 13,782.8 | 13,684.8 | 13,718.9 | 13,303.3 | 13,102.1 | 13,497.3 | W |
| 1995 | W | W | W | W | W | 14,666.7 | W | 14,734.3 | W | 14,088.3 | 13,799.7 | 13,823.8 |
| 1996 | 12,709.8 | 13,329.2 | 13,346.5 | 13,815.9 | 14,305.9 | 14,173.3 | 14,443.6 | 14,629.1 | 13,575.1 | 14,093.4 | 13,988.4 | 13,708.6 |
| 1997 | 13,010.3 | 13,191.6 | 13,602.8 | 13,950.5 | 14,186.2 | 14,680.3 | 14,756.0 | 14,720.8 | 14,400.8 | 14,900.7 | 13,965.3 | 14,462.6 |
| 1998 | 12,959.1 | 13,507.8 | 13,995.4 | 14,300.4 | 14,641.6 | 14,911.2 | 15,160.1 | 14,862.7 | 14,380.0 | 14,738.4 | 14,146.6 | 14,254.0 |
| 1999 | 12,433.2 | 13,780.3 | 13,732.3 | 14,311.7 | 14,628.5 | 14,884.9 | 15,091.8 | 14,712.1 | 14,316.1 | 14,702.9 | 14,350.8 | 15,224.8 |
| 2000 | 12,480.5 | 13,363.4 | 14,117.3 | 14,510.9 | 14,601.8 | 14,772.0 | 14,898.9 | 15,102.8 | 14,389.3 | 14,454.9 | 14,421.7 | 14,626.9 |
| 2001 | 13,332.3 | 13,974.5 | 14,045.6 | 14,246.7 | 14,052.2 | 15,179.2 | 14,407.4 | 14,600.9 | 14,416.3 | 14,815.6 | 14,103.7 | 14,014.4 |
| 2002 | 13,604.2 | 13,829.9 | 13,120.7 | 14,502.9 | 14,606.7 | 14,793.0 | 14,789.2 | 14,848.5 | 13,693.0 | 14,335.0 | 14,077.5 | 13,701.0 |
| 2003 | 12,915.5 | 12,840.1 | 13,256.7 | 13,864.2 | 14,134.0 | 14,235.8 | 14,730.6 | 14,930.1 | 14,513.6 | 14,709.8 | 14,188.3 | 14,298.3 |
| 2004 | 13,097.4 | 13,315.9 | 13,695.5 | 13,954.6 | 14,387.8 | 14,785.8 | 14,511.4 | 14,837.3 | 14,308.2 | 14,065.3 | 14,094.4 | 14,413.6 |
| 2005 | 12,717.1 | 13,522.3 | 13,485.7 | 13,765.3 | 14,368.3 | 14,673.3 | 14,368.1 | 14,491.2 | 13,473.2 | 13,824.8 | 14,059.8 | 13,973.5 |
| 2006 | 12,962.1 | 13,609.9 | 13,705.2 | 13,985.7 | 14,300.6 | 15,262.8 | 14,984.4 | 15,602.6 | 14,328.3 | 14,391.8 | 13,850.4 | 14,140.0 |
| 2007 | 13,180.6 | 13,091.0 | 13,710.4 | 14,081.5 | 13,897.7 | 14,492.8 | 14,204.5 | 14,406.7 | 14,006.7 | 13,967.1 | 13,731.9 | 13,579.2 |
| 2008 | 12,999.1 | 13,126.6 | 13,118.6 | 13,752.4 | 13,568.0 | 13,705.7 | 14,179.6 | 13,578.1 | 13,318.5 | 13,956.5 | 13,455.1 | 13,037.5 |
| 2009 | 12,334.9 | 13,072.4 | 13,040.5 | 13,356.6 | 13,440.3 | 13,667.0 | 13,618.1 | 13,561.4 | 13,154.9 | 12,844.1 | 12,757.7 | 13,043.7 |
| 2010 | 11,893.9 | 12,160.9 | 12,525.8 | 13,156.8 | 13,526.8 | 13,631.8 | 13,218.2 | 13,497.6 | 13,437.6 | 13,440.6 | 13,042.9 | 12,716.1 |
| 2011 | 11,737.7 | 11,884.1 | 12,310.2 | 12,294.0 | 12,326.8 | 12,983.8 | 12,762.6 | 12,728.6 | 12,489.6 | 12,303.5 | 12,227.1 | 11,976.2 |
| 2012 | 11,367.2 | 12,066.9 | 12,183.4 | 13,197.4 | 13,478.0 | 13,856.9 | 12,971.9 | 13,400.2 | 12,801.0 | 13,575.0 | 13,130.7 | 12,620.6 |
| 2013 | 12,421.1 | 12,269.1 | 12,291.1 | 12,783.6 | 13,009.1 | 13,040.3 | 12,704.4 | 13,060.9 | 12,702.2 | 12,938.8 | 12,777.4 | 12,385.3 |
| 2014 | 11,583.6 | 11,983.6 | 11,896.2 | 12,490.9 | 12,843.4 | 12,846.7 | 13,169.9 | 13,130.8 | 12,984.0 | 12,976.5 | 12,614.8 | 12,937.4 |
| 2015 | 12,101.4 | 12,422.8 | 12,662.8 | 13,108.3 | 13,346.7 | 13,192.3 | 13,628.1 | 13,345.7 | 13,145.3 | 13,092.2 | 12,911.6 | 12,554.4 |
| 2016 | 12,175.0 | 12,397.7 | 12,491.5 | 13,069.6 | 13,062.0 | 13,505.0 | 13,164.7 | 13,471.6 | 13,590.2 | 13,257.5 | 13,158.7 | 12,899.4 |
| 2017 | 12,155.7 | 12,422.7 | 12,885.4 | 13,060.0 | 13,546.2 | 13,714.2 | 13,256.5 | 13,929.6 | 13,195.4 | 13,267.3 | 13,112.0 | 13,220.1 |
| 2018 | 12,230.7 | 12,603.7 | 12,995.7 | 13,217.0 | 13,928.0 | 13,807.5 | 13,459.5 | 13,943.8 | 13,167.1 | 13,700.0 | 13,452.9 | 13,225.0 |
| 2019 | 12,291.1 | 12,605.9 | 13,212.5 | 13,580.4 | 13,994.0 | 13,913.6 | 13,796.6 | 13,960.1 | 13,307.0 | 14,128.6 | 13,791.2 | 13,753.6 |
| 2020 | 12,926.4 | 13,267.0 | 11,522.8 | 8,936.6 | 10,591.9 | 12,588.5 | 12,856.5 | 12,573.9 | 12,731.2 | 12,742.7 | 12,037.8 | 11,694.8 |
| 2021 | 11,445.7 | 11,601.7 | 12,622.5 | 13,146.0 | 13,583.5 | 13,634.0 | 13,717.6 | 13,879.9 | 13,330.0 | 13,041.0 | 12,880.7 | 12,754.6 |
| 2022 | 11,610.1 | 12,356.8 | 12,574.7 | |||||||||
| - = No Data Reported; -- = Not Applicable; NA = Not Available; W = Withheld to avoid disclosure of individual company data. |
| Release Date: 5/19/2022 |
| Next Release Date: TBD |