|
Download Data (XLS File) |
|
||||||||
|
||||||||
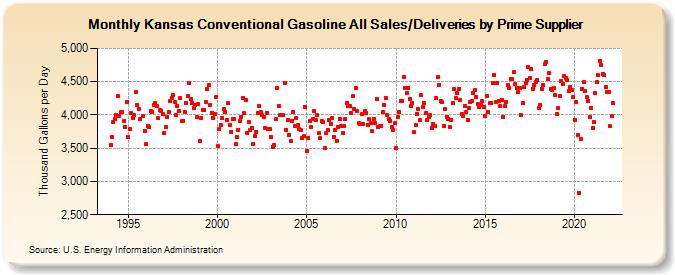
| Kansas Conventional Gasoline All Sales/Deliveries by Prime Supplier (Thousand Gallons per Day) | ||||||||
| Year | Jan | Feb | Mar | Apr | May | Jun | Jul | Aug | Sep | Oct | Nov | Dec |
|---|---|---|---|---|---|---|---|---|---|---|---|---|
| 1993 | NA | NA | NA | |||||||||
| 1994 | 3,548.7 | 3,665.1 | 3,900.0 | 3,933.7 | 4,003.1 | 4,282.1 | 3,987.2 | 4,041.2 | 4,044.4 | 3,904.5 | 3,818.4 | 4,199.5 |
| 1995 | 3,663.5 | 3,782.9 | 4,024.0 | 3,953.9 | 3,992.9 | 4,346.9 | 4,153.6 | 4,095.5 | 3,934.8 | W | 3,976.3 | 3,761.4 |
| 1996 | 3,561.1 | 3,835.8 | 3,825.8 | 4,057.6 | 4,049.3 | 4,143.8 | 4,172.1 | 4,136.6 | 3,946.8 | 4,073.1 | 4,063.6 | 4,008.4 |
| 1997 | 3,735.4 | 3,818.3 | 3,970.0 | 4,042.0 | 4,209.1 | 4,257.7 | 4,299.1 | 4,191.1 | 4,001.3 | 4,139.1 | 4,066.1 | 4,252.3 |
| 1998 | 3,912.3 | 3,908.9 | 4,036.6 | 4,181.7 | 4,279.4 | 4,474.2 | 4,233.1 | 4,184.1 | 4,108.3 | 4,145.9 | 3,961.7 | 4,169.8 |
| 1999 | 3,605.8 | 3,952.7 | 4,075.7 | 4,068.6 | 4,188.5 | 4,386.1 | 4,448.3 | 4,153.0 | 4,033.9 | 3,958.5 | 4,020.1 | 4,273.2 |
| 2000 | 3,530.1 | 3,789.9 | 3,852.3 | 3,958.8 | 4,090.8 | 4,050.1 | 3,922.7 | 4,174.7 | 3,848.0 | 3,743.8 | 3,942.3 | 3,943.9 |
| 2001 | 3,561.0 | 3,663.6 | 3,779.8 | 3,912.1 | 3,973.5 | 4,260.1 | 4,022.9 | 4,226.1 | 3,726.5 | 3,894.7 | 3,778.6 | 3,809.2 |
| 2002 | 3,558.1 | 3,686.4 | 3,741.9 | 4,025.2 | 4,134.4 | 4,046.7 | 3,991.7 | 3,970.9 | 3,805.8 | 4,028.2 | 3,789.6 | 3,780.9 |
| 2003 | 3,669.9 | 3,524.5 | 3,554.0 | 3,931.8 | 4,402.3 | 4,141.4 | 3,999.6 | 4,003.4 | 3,994.9 | 4,473.1 | 3,777.4 | 3,917.5 |
| 2004 | 3,694.0 | 3,607.2 | 3,915.2 | 4,047.8 | 3,826.8 | 3,952.7 | 3,848.1 | 3,784.3 | 3,768.1 | 3,646.0 | 3,689.6 | 4,113.1 |
| 2005 | 3,457.3 | 3,654.8 | 3,903.8 | 3,820.6 | 3,944.9 | 4,056.7 | 3,921.5 | 3,994.3 | 3,723.9 | 3,651.8 | 3,909.0 | 3,888.3 |
| 2006 | 3,498.3 | 3,726.2 | 3,766.4 | 3,926.8 | 3,868.3 | 3,948.5 | 3,675.6 | 3,766.7 | 3,613.4 | 3,817.4 | 3,937.3 | 3,830.5 |
| 2007 | 3,725.9 | 3,833.0 | 3,931.4 | 4,176.8 | 4,134.7 | 4,127.7 | 4,022.3 | 4,277.2 | 4,086.4 | 4,407.5 | 4,058.9 | 3,872.3 |
| 2008 | 3,868.9 | 4,017.2 | 3,869.3 | 4,052.5 | 4,026.1 | 3,852.6 | 3,932.8 | 3,880.1 | 3,752.3 | 3,945.9 | 3,871.8 | 4,241.3 |
| 2009 | 3,824.1 | 3,828.0 | 3,833.1 | 4,046.5 | 4,153.1 | 4,257.9 | 3,992.4 | 3,941.1 | 3,906.9 | 3,824.4 | 3,779.7 | 3,872.1 |
| 2010 | 3,506.8 | 3,970.5 | 4,042.3 | 4,208.3 | 4,216.4 | 4,572.9 | 4,410.0 | 4,333.7 | 4,402.1 | 4,239.8 | 4,138.8 | 4,179.8 |
| 2011 | 3,738.3 | 3,855.1 | 4,007.4 | 4,082.7 | 3,919.0 | 4,293.3 | 4,122.3 | 4,178.5 | 4,031.8 | 3,921.5 | 3,970.1 | 3,997.8 |
| 2012 | 3,810.7 | 3,867.1 | 3,832.5 | 4,249.0 | 4,571.1 | 4,445.3 | 4,213.6 | 4,189.6 | 3,830.5 | 4,082.3 | 3,971.0 | 3,936.4 |
| 2013 | 3,819.7 | 3,924.0 | 4,171.7 | 4,389.1 | 4,260.7 | 4,324.7 | 4,395.3 | 4,225.9 | 4,012.5 | 3,988.2 | 4,138.9 | 4,040.6 |
| 2014 | 3,927.4 | 4,108.5 | 4,196.7 | 4,213.4 | 4,322.8 | 4,371.1 | 4,276.2 | 4,165.9 | 4,118.0 | 4,144.2 | 4,205.0 | 4,120.1 |
| 2015 | 3,981.8 | 4,290.8 | 4,049.5 | 4,186.6 | 4,175.5 | 4,477.8 | 4,597.3 | 4,191.3 | 4,474.3 | 4,210.7 | 4,136.2 | 4,227.5 |
| 2016 | 3,964.1 | 4,129.7 | 4,199.3 | 4,456.3 | 4,411.5 | 4,534.4 | 4,535.0 | 4,641.7 | 4,466.2 | 4,403.5 | 4,348.2 | 4,398.7 |
| 2017 | 3,998.3 | 4,185.9 | 4,425.3 | 4,481.5 | 4,526.1 | 4,724.8 | 4,559.4 | 4,683.0 | 4,394.9 | 4,454.6 | 4,493.6 | 4,518.6 |
| 2018 | 4,103.3 | 4,144.2 | 4,393.2 | 4,443.6 | 4,762.2 | 4,798.7 | 4,533.9 | 4,629.6 | 4,396.6 | 4,377.3 | 4,405.4 | 4,293.5 |
| 2019 | 4,011.7 | 4,098.5 | 4,288.3 | 4,509.2 | 4,461.6 | 4,583.5 | 4,559.2 | 4,521.3 | 4,352.5 | 4,421.9 | 4,375.4 | 4,264.4 |
| 2020 | 3,923.8 | 4,198.3 | 3,705.0 | 2,831.4 | 3,634.9 | 4,396.0 | 4,487.9 | 4,353.5 | 4,273.9 | 4,205.5 | 3,969.0 | 4,107.9 |
| 2021 | 3,800.0 | 3,893.0 | 4,329.5 | 4,494.4 | 4,596.3 | 4,812.2 | 4,743.1 | 4,616.5 | 4,593.0 | 4,425.5 | 4,343.9 | 4,350.0 |
| 2022 | 3,826.1 | 3,987.0 | 4,175.3 | |||||||||
| - = No Data Reported; -- = Not Applicable; NA = Not Available; W = Withheld to avoid disclosure of individual company data. |
| Release Date: 5/19/2022 |
| Next Release Date: TBD |