|
Download Data (XLS File) |
|
||||||||
|
||||||||
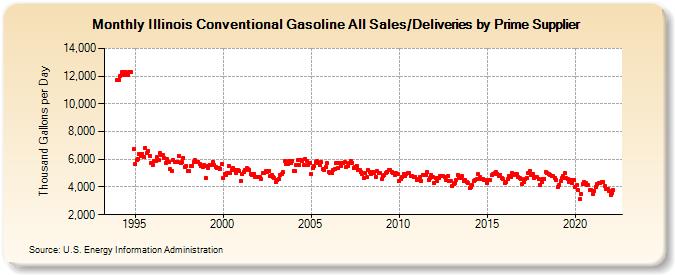
| Illinois Conventional Gasoline All Sales/Deliveries by Prime Supplier (Thousand Gallons per Day) | ||||||||
| Year | Jan | Feb | Mar | Apr | May | Jun | Jul | Aug | Sep | Oct | Nov | Dec |
|---|---|---|---|---|---|---|---|---|---|---|---|---|
| 1993 | NA | NA | NA | |||||||||
| 1994 | 11,686.7 | 11,748.0 | 12,003.7 | 12,267.7 | 12,094.4 | 12,322.6 | 12,093.9 | 12,058.3 | 12,265.7 | 12,331.1 | W | 6,730.1 |
| 1995 | 5,627.5 | 5,915.8 | 6,034.7 | 6,366.7 | 6,230.8 | 6,405.0 | 6,167.5 | 6,840.0 | 6,487.0 | 6,611.6 | 6,264.3 | 5,735.4 |
| 1996 | 5,595.5 | 5,876.1 | 5,892.9 | 6,163.3 | 5,931.4 | 6,486.7 | 6,296.5 | 6,278.3 | 6,087.4 | 5,758.9 | 5,989.8 | 5,787.7 |
| 1997 | 5,263.3 | 5,187.1 | 5,953.7 | 5,811.2 | 5,790.5 | 5,794.4 | 6,266.5 | 5,699.2 | 5,794.0 | 6,125.6 | 5,457.5 | 5,502.8 |
| 1998 | 5,159.0 | 5,163.1 | 5,491.0 | 5,532.8 | 5,815.0 | 5,915.2 | 5,826.1 | 5,830.5 | 5,667.8 | 5,514.3 | 5,453.8 | 5,552.8 |
| 1999 | 4,673.3 | 5,480.9 | 5,338.3 | 5,621.8 | 5,552.8 | 5,806.7 | 5,603.0 | 5,421.8 | 5,344.3 | 5,379.0 | 5,324.4 | 5,624.7 |
| 2000 | 4,619.6 | 4,929.1 | 4,862.5 | 4,976.5 | 5,504.1 | 5,001.0 | 5,211.3 | 5,364.0 | 5,240.7 | 4,985.4 | 5,255.3 | 5,155.5 |
| 2001 | 4,448.3 | 4,912.6 | 5,091.4 | 5,223.4 | 5,348.8 | 5,313.5 | 5,237.5 | 4,936.4 | 4,889.3 | 4,944.2 | 4,757.1 | 4,699.8 |
| 2002 | 4,738.3 | 4,715.8 | 4,588.9 | 5,018.6 | 4,988.7 | 5,128.8 | 5,107.1 | 5,189.8 | 4,759.2 | 4,835.0 | 4,752.0 | 4,615.5 |
| 2003 | 4,350.9 | 4,516.4 | 4,592.9 | 4,845.1 | 4,910.3 | 5,078.7 | 5,841.9 | 5,667.7 | 5,683.6 | 5,872.3 | 5,737.3 | 5,862.5 |
| 2004 | 5,158.8 | 5,135.3 | 5,604.2 | 5,929.1 | 5,575.8 | 5,982.3 | 5,863.1 | 5,585.3 | 6,020.2 | 5,847.7 | 5,607.7 | 5,739.4 |
| 2005 | 4,968.8 | 5,374.3 | 5,479.0 | 5,789.9 | 5,850.6 | 5,728.2 | 5,601.2 | 5,781.8 | 5,271.0 | 5,254.9 | 5,426.2 | 5,697.4 |
| 2006 | 5,088.9 | 5,040.4 | 4,997.6 | 5,261.8 | 5,294.1 | 5,704.9 | 5,387.9 | 5,716.7 | 5,526.9 | 5,699.6 | 5,756.5 | 5,767.4 |
| 2007 | 5,442.7 | 5,508.8 | 5,710.9 | 5,896.1 | 5,750.4 | 5,389.4 | 5,455.4 | 5,548.9 | 5,205.5 | 5,244.4 | 5,091.6 | 4,923.7 |
| 2008 | 4,626.8 | 5,009.6 | 4,692.9 | 5,225.7 | 5,096.9 | 4,958.9 | 5,091.0 | 5,022.9 | 4,750.8 | 5,133.2 | 5,013.8 | 5,003.5 |
| 2009 | 4,559.0 | 4,802.8 | 4,836.4 | 5,011.7 | 5,092.9 | 5,199.4 | 5,216.8 | 5,092.0 | 4,974.4 | 4,897.0 | 4,978.7 | 4,950.6 |
| 2010 | 4,403.9 | 4,610.2 | 4,694.2 | 4,950.9 | 4,775.9 | 4,961.7 | 5,016.7 | 5,008.9 | 4,806.7 | 4,803.8 | 4,686.5 | 4,742.5 |
| 2011 | 4,476.2 | 4,586.8 | 4,703.3 | 4,424.0 | 4,888.7 | 4,890.1 | 4,845.7 | 5,089.9 | 4,535.7 | 4,618.1 | 4,887.5 | 4,709.5 |
| 2012 | 4,283.1 | 4,660.9 | 4,413.3 | 4,672.9 | 4,828.0 | 4,801.1 | 4,773.3 | 4,717.7 | 4,498.0 | 4,765.3 | 4,456.5 | 4,401.9 |
| 2013 | 4,105.2 | 4,235.7 | 4,264.0 | 4,512.5 | 4,896.5 | 4,630.6 | 4,660.4 | 4,769.5 | 4,428.8 | 4,528.7 | 4,365.7 | 4,253.3 |
| 2014 | 3,894.6 | 3,983.9 | 4,132.8 | 4,450.2 | 4,511.6 | 4,607.0 | 4,904.2 | 4,727.0 | 4,556.4 | 4,552.7 | 4,513.2 | 4,502.3 |
| 2015 | 4,253.8 | 4,536.5 | 4,496.2 | 4,834.2 | 4,905.6 | 4,991.9 | 5,064.7 | 4,956.6 | 4,825.7 | 4,883.5 | 4,630.7 | 4,552.0 |
| 2016 | 4,317.9 | 4,387.4 | 4,544.4 | 4,785.9 | 4,710.0 | 4,997.0 | 4,889.0 | 4,953.2 | 4,963.7 | 4,723.2 | 4,683.5 | 4,541.2 |
| 2017 | 4,180.2 | 4,371.4 | 4,580.1 | 4,665.1 | 5,002.1 | 5,169.0 | 4,854.9 | 4,956.2 | 4,652.3 | 4,704.1 | 4,691.4 | 4,541.4 |
| 2018 | 4,152.9 | 4,348.5 | 4,607.0 | 4,595.9 | 5,068.5 | 4,997.8 | 4,941.6 | 4,884.6 | 4,781.6 | 4,792.6 | 4,674.6 | 4,505.7 |
| 2019 | 4,000.8 | 4,152.8 | 4,406.5 | 4,618.9 | 4,799.2 | 4,979.6 | 4,624.3 | 4,579.4 | 4,330.8 | 4,533.0 | 4,309.7 | 4,473.8 |
| 2020 | 3,992.7 | 4,118.5 | 3,749.6 | 3,116.4 | 3,517.3 | 4,226.2 | 4,354.4 | 4,260.1 | 4,151.2 | 4,113.8 | 3,748.2 | 3,767.8 |
| 2021 | 3,522.9 | 3,706.5 | 3,986.6 | 4,182.1 | 4,275.4 | 4,300.0 | 4,373.1 | 4,353.9 | 4,057.3 | 3,884.6 | 3,880.3 | 3,737.2 |
| 2022 | 3,440.3 | 3,565.0 | 3,768.4 | |||||||||
| - = No Data Reported; -- = Not Applicable; NA = Not Available; W = Withheld to avoid disclosure of individual company data. |
| Release Date: 5/19/2022 |
| Next Release Date: TBD |