|
Download Data (XLS File) |
|
||||||||
|
||||||||
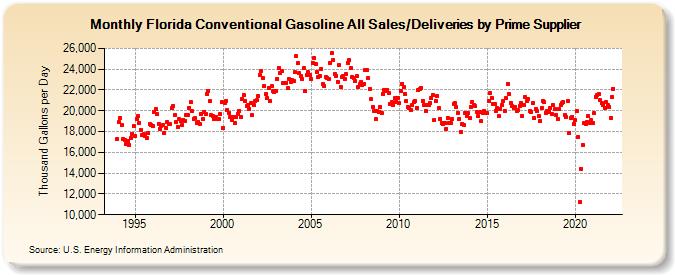
| Florida Conventional Gasoline All Sales/Deliveries by Prime Supplier (Thousand Gallons per Day) | ||||||||
| Year | Jan | Feb | Mar | Apr | May | Jun | Jul | Aug | Sep | Oct | Nov | Dec |
|---|---|---|---|---|---|---|---|---|---|---|---|---|
| 1993 | NA | NA | NA | |||||||||
| 1994 | 17,299.8 | 18,881.0 | 19,343.5 | 18,626.9 | 17,289.5 | 17,219.7 | 16,849.1 | 17,132.0 | 16,724.2 | 17,341.0 | 17,812.5 | 18,550.7 |
| 1995 | 17,549.4 | 19,199.8 | 19,468.0 | 18,868.7 | 18,184.6 | 17,707.3 | 17,732.4 | 17,602.1 | 17,402.6 | 17,905.0 | 18,707.2 | 18,625.8 |
| 1996 | 18,532.8 | 19,899.1 | 20,152.7 | 19,648.7 | 18,760.4 | 18,292.3 | 18,582.0 | 18,592.0 | 17,862.0 | 18,349.5 | 18,894.3 | 18,725.3 |
| 1997 | 18,690.4 | 20,224.4 | 20,455.6 | 19,572.7 | 18,962.5 | 18,465.3 | 19,180.7 | 19,028.7 | 18,677.4 | 19,147.2 | 19,058.3 | 19,634.0 |
| 1998 | 19,602.3 | 20,295.5 | 20,812.8 | 19,970.5 | 19,250.7 | 19,313.2 | 18,847.7 | 18,924.4 | 18,744.6 | 19,686.9 | 19,160.5 | 19,910.1 |
| 1999 | 19,646.6 | 21,600.4 | 21,916.1 | 20,906.4 | 19,562.6 | 19,540.3 | 19,220.8 | 19,364.9 | 19,244.9 | 19,230.5 | 19,695.2 | 20,823.6 |
| 2000 | 18,351.8 | 20,748.7 | 20,971.6 | 20,089.2 | 19,796.9 | 19,409.9 | 19,109.4 | 19,418.9 | 18,846.6 | 19,365.8 | 19,728.2 | 20,010.0 |
| 2001 | 19,444.8 | 21,136.6 | 21,534.0 | 20,954.2 | 20,474.1 | 20,515.9 | 20,174.3 | 20,739.1 | 19,588.1 | 20,546.1 | 20,935.1 | 21,005.0 |
| 2002 | 21,416.1 | 23,419.1 | 23,843.6 | 23,194.9 | 22,359.1 | 21,597.2 | 21,213.8 | 22,217.2 | 20,934.6 | 22,360.8 | 21,856.9 | 21,767.4 |
| 2003 | 21,910.2 | 23,091.8 | 24,123.9 | 23,585.7 | 23,808.9 | 22,636.8 | 22,713.2 | 22,699.6 | 22,176.5 | 23,054.9 | 22,781.1 | 22,970.1 |
| 2004 | 22,854.1 | 23,683.5 | 25,237.6 | 24,563.6 | 23,600.9 | 23,379.9 | 23,073.1 | 24,070.8 | 21,854.5 | 23,414.0 | 23,680.9 | 23,478.8 |
| 2005 | 23,029.0 | 24,631.0 | 25,123.1 | 24,545.2 | 23,744.0 | 23,222.0 | 23,359.2 | 24,022.3 | 22,556.5 | 22,370.9 | 23,260.4 | 23,158.4 |
| 2006 | 23,025.1 | 24,626.6 | 25,551.5 | 24,906.7 | 23,519.0 | 23,389.8 | 22,801.6 | 24,401.6 | 22,290.1 | 23,227.2 | 23,342.8 | 23,022.7 |
| 2007 | 23,522.5 | 24,625.6 | 24,848.7 | 24,117.9 | 23,250.1 | 23,170.0 | 22,904.2 | 23,300.3 | 22,327.9 | 22,541.1 | 22,776.2 | 22,495.9 |
| 2008 | 22,584.6 | 23,953.4 | 23,913.5 | 23,120.4 | 22,117.1 | 21,102.7 | 20,355.3 | 19,969.1 | 19,159.8 | 19,956.6 | 19,913.6 | 20,345.2 |
| 2009 | 19,742.2 | 21,595.4 | 21,953.9 | 21,930.1 | 22,016.6 | 21,714.6 | 20,660.5 | 20,818.4 | 20,599.1 | 21,184.9 | 20,868.6 | 21,267.7 |
| 2010 | 20,704.7 | 21,909.0 | 22,618.4 | 22,282.7 | 21,655.4 | 20,933.5 | 20,354.0 | 20,271.4 | 20,087.1 | 20,597.4 | 20,807.4 | 20,945.9 |
| 2011 | 20,307.7 | 21,960.2 | 22,104.7 | 22,215.0 | 20,972.5 | 20,573.4 | 20,023.0 | 20,552.1 | 20,568.6 | 20,710.8 | 21,268.2 | 21,517.4 |
| 2012 | 19,094.0 | 20,932.5 | 21,426.9 | 20,240.1 | 19,243.2 | 18,853.5 | 18,743.2 | 18,854.3 | 18,227.2 | 19,323.5 | 18,792.2 | 18,801.8 |
| 2013 | 19,181.0 | 20,674.3 | 20,707.5 | 20,360.5 | 19,825.1 | 19,215.0 | 17,996.3 | 18,738.1 | 18,642.0 | 19,741.5 | 19,521.1 | 19,751.0 |
| 2014 | 19,293.2 | 20,398.9 | 20,848.8 | 20,557.1 | 20,452.9 | 19,851.5 | 19,461.0 | 19,879.7 | 18,971.5 | 19,767.5 | 20,002.0 | 19,808.4 |
| 2015 | 19,759.9 | 20,950.6 | 21,706.2 | 21,234.7 | 20,692.6 | 20,622.8 | 19,990.7 | 20,246.1 | 19,451.1 | 20,200.0 | 20,563.9 | 20,899.8 |
| 2016 | 19,995.3 | 21,245.1 | 22,578.2 | 21,576.0 | 20,779.7 | 20,466.0 | 20,285.0 | 20,364.9 | 19,946.6 | 20,048.1 | 20,459.3 | 20,753.5 |
| 2017 | 19,528.5 | 20,591.0 | 21,320.6 | 20,962.9 | 21,117.3 | 19,963.0 | 19,925.3 | 20,744.8 | 19,261.4 | 20,183.7 | 19,968.2 | 19,459.8 |
| 2018 | 19,007.5 | 20,265.3 | 20,972.5 | 20,817.1 | 19,827.7 | 19,949.3 | 19,908.8 | 20,310.4 | 19,681.2 | 20,544.1 | 20,133.0 | 19,614.7 |
| 2019 | 19,211.6 | 20,169.0 | 20,588.4 | 20,701.4 | 20,798.8 | 19,600.1 | 19,413.6 | 20,974.6 | 17,892.2 | 19,279.9 | 19,427.3 | 18,737.0 |
| 2020 | 19,104.5 | 19,941.0 | 17,502.2 | 11,204.9 | 14,433.2 | 16,717.6 | 18,853.3 | 18,713.3 | 18,939.2 | 19,452.0 | 18,793.1 | 19,100.0 |
| 2021 | 18,849.3 | 19,781.5 | 21,324.3 | 21,544.6 | 21,600.1 | 21,028.5 | 20,738.0 | 20,593.8 | 20,233.2 | 20,804.5 | 20,512.4 | 20,352.2 |
| 2022 | 19,288.7 | 21,308.5 | 22,122.3 | |||||||||
| - = No Data Reported; -- = Not Applicable; NA = Not Available; W = Withheld to avoid disclosure of individual company data. |
| Release Date: 5/19/2022 |
| Next Release Date: TBD |