|
Download Data (XLS File) |
|
||||||||
|
||||||||
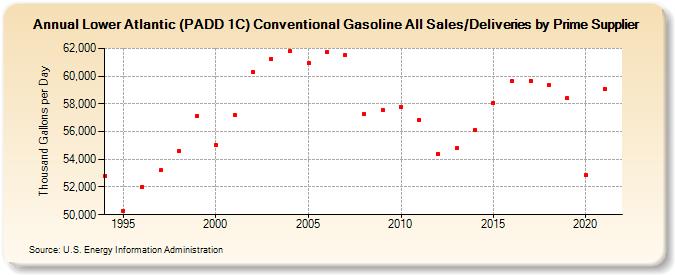
| Lower Atlantic (PADD 1C) Conventional Gasoline All Sales/Deliveries by Prime Supplier (Thousand Gallons per Day) | ||||||||
| Decade | Year-0 | Year-1 | Year-2 | Year-3 | Year-4 | Year-5 | Year-6 | Year-7 | Year-8 | Year-9 |
|---|---|---|---|---|---|---|---|---|---|---|
| 1990's | 52,816.0 | 50,289.6 | 52,034.1 | 53,196.6 | 54,619.7 | 57,111.0 | ||||
| 2000's | 55,000.8 | 57,220.0 | 60,328.2 | 61,235.0 | 61,789.3 | 60,917.3 | 61,767.3 | 61,495.8 | 57,267.5 | 57,556.0 |
| 2010's | 57,794.9 | 56,865.6 | 54,405.6 | 54,790.9 | 56,130.5 | 58,068.9 | 59,654.6 | 59,672.5 | 59,334.1 | 58,395.7 |
| 2020's | 52,855.3 |
| - = No Data Reported; -- = Not Applicable; NA = Not Available; W = Withheld to avoid disclosure of individual company data. |
| Release Date: 6/1/2022 |
| Next Release Date: TBD |