|
Download Data (XLS File) |
|
||||||||
|
||||||||
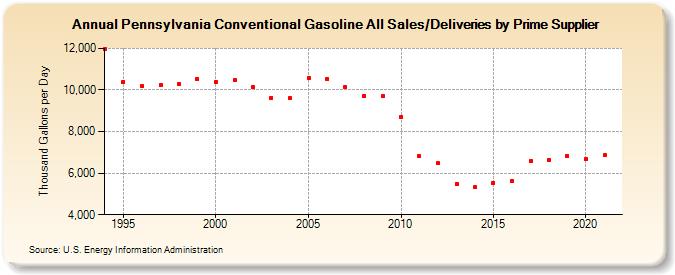
| Pennsylvania Conventional Gasoline All Sales/Deliveries by Prime Supplier (Thousand Gallons per Day) | ||||||||
| Decade | Year-0 | Year-1 | Year-2 | Year-3 | Year-4 | Year-5 | Year-6 | Year-7 | Year-8 | Year-9 |
|---|---|---|---|---|---|---|---|---|---|---|
| 1990's | 11,980.5 | 10,403.1 | 10,195.2 | 10,231.0 | 10,301.9 | 10,544.5 | ||||
| 2000's | 10,383.8 | 10,463.8 | 10,125.3 | 9,635.4 | 9,596.4 | 10,564.0 | 10,530.4 | 10,131.3 | 9,723.3 | 9,703.3 |
| 2010's | 8,690.1 | 6,810.0 | 6,465.9 | 5,485.4 | 5,310.9 | 5,538.3 | 5,631.4 | 6,572.0 | 6,644.4 | 6,820.7 |
| 2020's | 6,670.0 |
| - = No Data Reported; -- = Not Applicable; NA = Not Available; W = Withheld to avoid disclosure of individual company data. |
| Release Date: 6/1/2022 |
| Next Release Date: TBD |