|
Download Data (XLS File) |
|
||||||||
|
||||||||
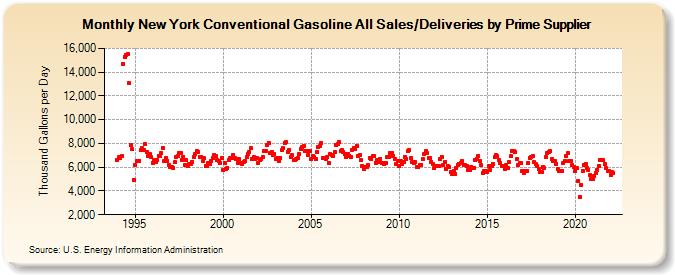
| New York Conventional Gasoline All Sales/Deliveries by Prime Supplier (Thousand Gallons per Day) | ||||||||
| Year | Jan | Feb | Mar | Apr | May | Jun | Jul | Aug | Sep | Oct | Nov | Dec |
|---|---|---|---|---|---|---|---|---|---|---|---|---|
| 1993 | NA | NA | NA | |||||||||
| 1994 | 6,621.5 | 6,825.5 | 6,789.9 | 6,918.4 | 14,723.9 | 15,315.4 | 15,451.1 | 15,547.5 | 13,064.5 | 7,890.4 | 7,491.5 | 4,905.2 |
| 1995 | 6,211.8 | 6,510.4 | 6,533.0 | 6,553.4 | 7,415.9 | 7,609.1 | 7,476.1 | 7,912.6 | 7,238.5 | 6,974.9 | 7,085.6 | 6,840.6 |
| 1996 | 6,364.2 | 6,589.2 | 6,440.5 | 6,620.0 | 6,975.9 | 6,910.5 | 7,220.4 | 7,656.3 | 6,489.8 | 6,772.0 | 6,545.8 | 6,226.5 |
| 1997 | 6,027.5 | 6,045.1 | 5,962.7 | 6,431.4 | 6,890.1 | 6,916.8 | 7,203.6 | 7,209.5 | 6,642.0 | 6,861.3 | 6,214.8 | 6,577.8 |
| 1998 | 6,092.6 | 6,268.8 | 6,238.1 | 6,456.4 | 6,858.3 | 7,129.6 | 7,402.4 | 7,302.2 | 6,867.8 | 6,880.8 | 6,515.7 | 6,738.7 |
| 1999 | 6,093.6 | 6,093.1 | 6,381.9 | 6,268.5 | 6,498.9 | 6,762.3 | 7,036.7 | 6,922.2 | 6,588.2 | 6,533.4 | 6,337.4 | 6,794.0 |
| 2000 | 5,775.6 | 6,392.1 | 5,868.9 | 5,942.3 | 6,595.1 | 6,785.2 | 6,790.0 | 7,044.9 | 6,781.9 | 6,728.2 | 6,394.6 | 6,666.2 |
| 2001 | 6,368.1 | 6,289.2 | 6,467.6 | 6,529.7 | 6,846.8 | 7,150.8 | 7,271.0 | 7,575.9 | 6,719.4 | 6,857.5 | 6,652.5 | 6,804.2 |
| 2002 | 6,377.0 | 6,593.5 | 6,650.8 | 6,836.6 | 7,372.3 | 7,384.3 | 7,863.7 | 8,045.2 | 7,188.0 | 7,269.2 | 7,034.9 | 7,143.2 |
| 2003 | 6,674.6 | 6,767.0 | 6,504.2 | 6,810.0 | 7,439.3 | 7,579.3 | 8,072.5 | 8,097.9 | 7,307.7 | 7,449.5 | 6,845.4 | 6,986.9 |
| 2004 | 6,632.6 | 6,569.6 | 6,686.0 | 6,799.9 | 7,089.0 | 7,518.7 | 7,740.9 | 7,810.3 | 7,330.7 | 7,341.3 | 7,049.6 | 7,347.5 |
| 2005 | 6,703.6 | 6,912.8 | 6,819.7 | 6,718.2 | 7,302.0 | 7,707.6 | 7,793.7 | 8,013.7 | 6,784.7 | 6,757.8 | 6,709.9 | 6,851.4 |
| 2006 | 6,349.3 | 7,095.1 | 7,051.9 | 6,930.0 | 7,273.7 | 7,874.2 | 7,968.7 | 8,133.1 | 7,352.2 | 7,489.1 | 7,278.9 | 7,140.0 |
| 2007 | 6,828.5 | 7,109.4 | 6,928.2 | 6,844.6 | 7,478.0 | 7,633.3 | 7,504.2 | 7,820.8 | 6,963.6 | 7,008.8 | 6,586.7 | 6,135.9 |
| 2008 | 5,839.4 | 6,024.5 | 5,982.0 | 6,147.9 | 6,759.7 | 6,701.1 | 6,919.0 | 6,938.0 | 6,391.4 | 6,592.7 | 6,423.7 | 6,727.8 |
| 2009 | 6,367.0 | 6,313.3 | 6,240.7 | 6,333.0 | 6,816.6 | 6,884.6 | 7,198.4 | 7,195.7 | 6,946.4 | 6,730.2 | 6,248.0 | 6,528.0 |
| 2010 | 6,088.6 | 6,553.9 | 6,281.7 | 6,462.3 | 6,895.7 | 6,671.9 | 7,329.3 | 7,419.2 | 6,799.7 | 6,406.5 | 6,314.9 | 6,445.0 |
| 2011 | 6,034.4 | 5,996.4 | 6,164.2 | 6,212.9 | 6,658.7 | 7,081.8 | 7,344.7 | 7,194.1 | 6,782.4 | 6,799.5 | 6,474.8 | 6,242.1 |
| 2012 | 5,896.2 | 6,141.2 | 6,122.5 | 6,117.0 | 6,662.0 | 6,899.5 | 6,179.3 | 6,395.2 | 5,872.2 | 6,098.7 | 6,001.1 | 5,574.4 |
| 2013 | 5,466.7 | 5,665.6 | 5,420.6 | 5,898.4 | 6,222.6 | 6,303.7 | 6,343.5 | 6,508.2 | 6,186.2 | 6,170.8 | 6,063.5 | 5,756.7 |
| 2014 | 5,745.3 | 6,025.0 | 5,928.5 | 5,966.7 | 6,591.3 | 6,657.5 | 6,961.9 | 6,503.4 | 6,156.5 | 5,526.6 | 5,673.6 | 5,708.2 |
| 2015 | 5,584.9 | 6,111.6 | 5,800.6 | 6,140.0 | 6,286.5 | 6,828.6 | 7,018.3 | 6,927.1 | 6,579.9 | 6,339.6 | 6,114.9 | 6,108.0 |
| 2016 | 5,825.2 | 6,204.8 | 5,945.6 | 6,430.1 | 6,925.9 | 7,332.5 | 7,338.7 | 7,274.9 | 6,662.4 | 6,194.0 | 6,316.2 | 6,340.7 |
| 2017 | 5,704.0 | 5,504.4 | 5,657.0 | 5,719.3 | 6,373.8 | 6,811.7 | 6,833.5 | 6,935.5 | 6,398.0 | 6,244.6 | 6,119.8 | 5,826.8 |
| 2018 | 5,573.1 | 5,569.1 | 6,055.6 | 5,947.9 | 6,878.8 | 7,213.7 | 7,292.6 | 7,358.7 | 6,716.1 | 6,547.1 | 6,542.0 | 6,303.7 |
| 2019 | 5,839.1 | 5,685.4 | 5,720.3 | 5,653.6 | 6,328.8 | 6,509.1 | 6,981.1 | 7,153.7 | 6,491.8 | 6,484.3 | 6,146.7 | 5,979.6 |
| 2020 | 5,678.0 | 5,946.3 | 4,864.0 | 3,507.0 | 4,499.9 | 5,711.8 | 6,204.9 | 6,273.5 | 5,932.5 | 5,774.0 | 5,339.9 | 5,047.5 |
| 2021 | 5,036.0 | 5,285.5 | 5,506.5 | 5,797.4 | 6,105.0 | 6,623.6 | 6,563.4 | 6,573.2 | 6,264.9 | 5,930.3 | 5,717.3 | 5,672.5 |
| 2022 | 5,314.4 | 5,590.1 | 5,494.7 | |||||||||
| - = No Data Reported; -- = Not Applicable; NA = Not Available; W = Withheld to avoid disclosure of individual company data. |
| Release Date: 5/19/2022 |
| Next Release Date: TBD |