|
Download Data (XLS File) |
|
||||||||
|
||||||||
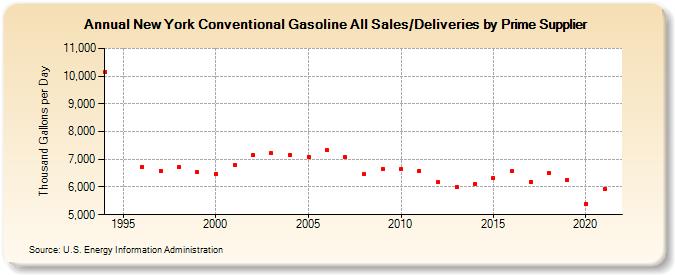
| New York Conventional Gasoline All Sales/Deliveries by Prime Supplier (Thousand Gallons per Day) | ||||||||
| Decade | Year-0 | Year-1 | Year-2 | Year-3 | Year-4 | Year-5 | Year-6 | Year-7 | Year-8 | Year-9 |
|---|---|---|---|---|---|---|---|---|---|---|
| 1990's | 10,149.7 | W | 6,736.1 | 6,586.6 | 6,732.9 | 6,529.8 | ||||
| 2000's | 6,481.0 | 6,798.9 | 7,151.5 | 7,215.7 | 7,162.7 | 7,092.2 | 7,329.6 | 7,070.5 | 6,456.7 | 6,653.4 |
| 2010's | 6,640.6 | 6,586.4 | 6,162.7 | 6,002.1 | 6,121.2 | 6,325.0 | 6,566.6 | 6,182.0 | 6,506.4 | 6,252.9 |
| 2020's | 5,398.3 |
| - = No Data Reported; -- = Not Applicable; NA = Not Available; W = Withheld to avoid disclosure of individual company data. |
| Release Date: 6/1/2022 |
| Next Release Date: TBD |