|
Download Data (XLS File) |
|
||||||||
|
||||||||
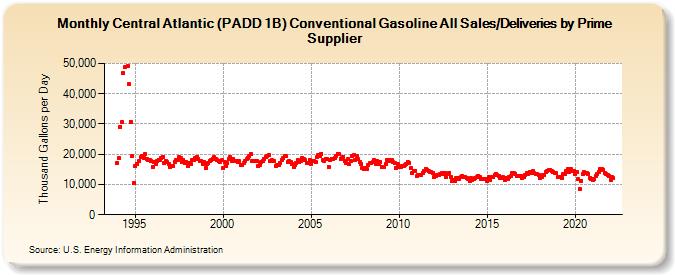
| Central Atlantic (PADD 1B) Conventional Gasoline All Sales/Deliveries by Prime Supplier (Thousand Gallons per Day) | ||||||||
| Year | Jan | Feb | Mar | Apr | May | Jun | Jul | Aug | Sep | Oct | Nov | Dec |
|---|---|---|---|---|---|---|---|---|---|---|---|---|
| 1993 | NA | NA | NA | |||||||||
| 1994 | 17,176.4 | 18,657.5 | 29,110.7 | 30,616.4 | 46,688.9 | 48,755.7 | W | 49,102.4 | 43,231.3 | 30,661.7 | 19,347.2 | 10,542.6 |
| 1995 | 15,974.1 | 16,858.2 | W | 17,871.4 | 19,111.9 | 19,443.6 | 18,839.3 | 20,123.9 | 18,354.8 | 18,141.0 | 18,195.9 | 17,752.6 |
| 1996 | 15,887.8 | 17,526.9 | 16,718.2 | 17,913.3 | 18,187.1 | 17,986.6 | 18,907.6 | 19,202.3 | 16,975.3 | 17,903.2 | 17,288.1 | 16,692.8 |
| 1997 | 15,849.5 | 16,031.8 | 16,091.2 | 17,588.7 | 18,040.2 | 18,162.0 | 18,961.3 | 18,776.8 | 17,346.6 | 18,161.5 | 17,026.5 | 17,461.0 |
| 1998 | 16,132.4 | 17,077.2 | 16,888.4 | 17,926.3 | 18,004.6 | 18,634.3 | 19,023.0 | 18,465.3 | 17,850.4 | 17,694.5 | 16,821.7 | 17,529.8 |
| 1999 | 15,367.4 | 16,625.6 | 17,051.0 | 17,887.8 | 17,965.9 | 18,522.9 | 19,002.8 | 18,522.1 | 18,024.6 | 17,663.8 | 17,567.4 | 18,002.5 |
| 2000 | 15,346.4 | 17,310.7 | 16,162.0 | 17,021.9 | 18,325.7 | 18,999.2 | 17,768.7 | 18,380.8 | 17,792.6 | 17,869.4 | 17,292.0 | 17,667.7 |
| 2001 | 16,301.9 | 16,475.5 | 16,959.8 | 17,723.8 | 18,293.8 | 18,876.0 | 19,398.2 | 20,140.5 | 17,594.4 | 17,807.2 | 17,631.7 | 17,602.4 |
| 2002 | 16,008.4 | 16,586.5 | 17,302.1 | 17,728.1 | 18,564.4 | 19,131.5 | 19,400.9 | 19,711.8 | 17,774.5 | 18,050.7 | 17,620.2 | 17,745.0 |
| 2003 | 16,155.5 | 16,384.6 | 16,409.8 | 17,261.0 | 18,120.5 | 18,590.9 | 19,399.2 | 19,374.2 | 17,451.3 | 17,867.9 | 17,418.2 | 16,891.1 |
| 2004 | 15,879.3 | 16,498.4 | 16,950.7 | 18,141.5 | 17,294.5 | 17,848.9 | 18,853.0 | 18,361.3 | 17,932.8 | 17,103.6 | 17,136.2 | 18,244.0 |
| 2005 | 16,907.7 | 17,674.3 | 17,853.2 | 17,574.9 | 19,020.6 | 19,866.2 | 19,421.9 | 20,212.5 | 17,977.2 | 17,747.2 | 18,552.9 | 18,408.4 |
| 2006 | 15,825.9 | 18,184.1 | 18,584.9 | 18,513.1 | 18,721.6 | 19,522.2 | 20,188.6 | 20,040.7 | 18,556.2 | 18,697.3 | 19,169.6 | 17,832.8 |
| 2007 | 17,185.0 | 18,388.8 | 16,816.8 | 17,742.5 | 19,547.1 | 19,582.9 | 17,981.3 | 19,444.6 | 18,260.0 | 17,493.1 | 16,804.4 | 15,417.4 |
| 2008 | 15,046.5 | 15,410.5 | 14,958.2 | 16,294.2 | 16,964.2 | 17,174.0 | 17,287.0 | 18,178.2 | 16,913.8 | 17,871.4 | 16,734.6 | 17,432.4 |
| 2009 | 15,875.2 | 15,762.7 | 15,869.8 | 16,778.0 | 18,052.9 | 17,800.9 | 18,142.3 | 17,945.8 | 17,311.8 | 17,000.9 | 15,522.7 | 16,712.9 |
| 2010 | 15,761.1 | 15,772.6 | 16,210.2 | 16,255.5 | 16,384.7 | 16,625.1 | 17,445.2 | 17,162.4 | 15,594.8 | 13,789.2 | 14,345.1 | 14,608.9 |
| 2011 | 12,783.5 | 13,021.8 | 13,034.8 | 13,187.1 | 13,888.2 | 14,538.5 | 15,219.4 | 14,874.6 | 14,341.0 | 14,189.9 | 13,992.1 | 13,692.2 |
| 2012 | 12,346.5 | 12,886.2 | 13,122.6 | 13,137.7 | 13,344.3 | 13,658.9 | 13,480.9 | 13,774.8 | 12,552.0 | 13,492.6 | 13,910.4 | 12,491.2 |
| 2013 | 11,244.6 | 11,388.6 | 11,290.5 | 11,981.8 | 12,222.0 | 11,948.1 | 12,314.6 | 12,848.5 | 12,466.0 | 12,592.4 | 12,303.3 | 11,730.2 |
| 2014 | 11,185.4 | 11,974.9 | 11,567.7 | 11,686.8 | 12,292.0 | 12,443.6 | 12,927.1 | 12,305.5 | 11,787.2 | 11,714.4 | 11,771.3 | 11,830.0 |
| 2015 | 11,173.7 | 12,318.2 | 11,441.8 | 12,452.3 | 12,322.9 | 12,984.4 | 13,381.5 | 12,978.3 | 12,838.7 | 12,215.0 | 12,273.0 | 12,315.6 |
| 2016 | 11,550.4 | 12,287.4 | 11,762.8 | 12,471.9 | 12,653.4 | 13,752.8 | 13,681.0 | 13,525.7 | 12,855.1 | 12,825.8 | 12,755.2 | 12,884.3 |
| 2017 | 12,129.6 | 12,436.8 | 13,022.5 | 13,630.7 | 13,434.1 | 14,171.3 | 13,726.5 | 14,326.3 | 13,709.3 | 13,515.4 | 13,442.6 | 13,079.1 |
| 2018 | 12,148.5 | 12,314.8 | 13,175.3 | 13,059.5 | 14,277.7 | 14,517.2 | 14,699.1 | 14,837.7 | 14,343.0 | 14,137.5 | 13,723.4 | 13,639.3 |
| 2019 | 12,321.2 | 12,471.5 | 12,575.6 | 12,227.7 | 13,342.7 | 13,595.9 | 14,517.0 | 15,080.1 | 14,085.3 | 14,985.4 | 14,349.9 | 14,327.5 |
| 2020 | 13,447.2 | 14,120.6 | 11,694.1 | 8,655.6 | 11,181.2 | 13,376.5 | 14,019.1 | 13,875.8 | 13,767.1 | 13,471.1 | 12,294.1 | 11,917.6 |
| 2021 | 11,627.0 | 11,859.6 | 12,857.0 | 13,421.1 | 14,161.9 | 14,971.0 | 14,972.4 | 14,888.0 | 13,907.3 | 13,336.9 | 13,031.1 | 12,710.8 |
| 2022 | 11,564.0 | 12,335.8 | 12,012.6 | |||||||||
| - = No Data Reported; -- = Not Applicable; NA = Not Available; W = Withheld to avoid disclosure of individual company data. |
| Release Date: 5/19/2022 |
| Next Release Date: TBD |