|
Download Data (XLS File) |
|
||||||||
|
||||||||
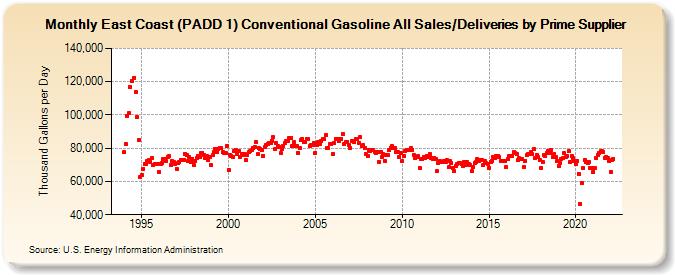
| East Coast (PADD 1) Conventional Gasoline All Sales/Deliveries by Prime Supplier (Thousand Gallons per Day) | ||||||||
| Year | Jan | Feb | Mar | Apr | May | Jun | Jul | Aug | Sep | Oct | Nov | Dec |
|---|---|---|---|---|---|---|---|---|---|---|---|---|
| 1993 | NA | NA | NA | |||||||||
| 1994 | 77,463.8 | 82,557.6 | 99,422.3 | 100,925.3 | 116,950.3 | 120,665.6 | W | 122,402.8 | 113,482.6 | 98,611.2 | 85,181.3 | 62,698.7 |
| 1995 | 63,669.1 | 67,663.3 | 70,621.7 | 70,339.4 | 72,386.3 | 72,973.0 | 71,854.3 | 74,257.7 | 69,901.6 | 70,655.9 | W | 70,652.5 |
| 1996 | 65,636.1 | 70,511.3 | 71,131.1 | 73,628.6 | 73,523.9 | 72,264.4 | 74,616.5 | 75,030.3 | 69,786.0 | 72,234.3 | 71,949.9 | 70,569.6 |
| 1997 | 67,669.2 | 70,809.5 | 71,876.3 | 73,069.9 | 73,039.9 | 72,739.6 | 76,659.4 | 75,748.3 | 72,006.7 | 74,595.3 | 71,755.4 | 73,746.6 |
| 1998 | 69,618.4 | 72,583.5 | 73,850.0 | 75,520.5 | 74,503.8 | 77,167.5 | 77,240.7 | 76,061.8 | 74,150.6 | 75,378.0 | 72,600.3 | 74,882.2 |
| 1999 | 69,874.1 | 75,684.2 | 77,542.8 | 79,478.7 | 77,820.4 | 79,760.1 | 80,197.2 | 79,924.6 | 77,647.6 | 77,130.6 | 77,327.9 | 81,242.2 |
| 2000 | 66,978.0 | 76,164.9 | 75,538.8 | 74,743.2 | 78,220.4 | 78,978.6 | 76,441.1 | 78,513.0 | 74,996.2 | 76,684.4 | 75,827.8 | 76,304.2 |
| 2001 | 72,741.5 | 75,638.9 | 77,562.3 | 78,384.3 | 79,193.2 | 80,116.2 | 80,703.4 | 83,502.3 | 76,222.0 | 79,912.4 | 79,533.9 | 78,732.1 |
| 2002 | 75,366.7 | 80,609.7 | 81,975.0 | 82,732.9 | 83,332.4 | 82,957.8 | 84,620.3 | 86,447.9 | 79,504.7 | 82,917.4 | 81,240.0 | 80,846.2 |
| 2003 | 76,928.9 | 79,430.2 | 81,251.4 | 82,881.2 | 84,613.2 | 84,019.5 | 86,235.7 | 86,280.1 | 81,447.4 | 83,523.6 | 81,023.3 | 81,554.2 |
| 2004 | 77,288.3 | 79,890.9 | 84,659.5 | 85,749.4 | 83,450.4 | 83,622.5 | 85,627.4 | 85,293.5 | 81,092.8 | 81,762.8 | 81,850.2 | 83,412.6 |
| 2005 | 77,176.2 | 81,946.8 | 83,831.3 | 82,806.2 | 84,260.2 | 85,340.9 | 85,367.8 | 87,911.3 | 79,903.4 | 80,056.9 | 82,455.1 | 82,263.9 |
| 2006 | 76,634.5 | 83,245.0 | 85,791.9 | 85,441.1 | 84,114.2 | 85,703.9 | 85,652.0 | 88,565.8 | 82,406.2 | 83,653.2 | 83,959.5 | 82,124.7 |
| 2007 | 80,320.6 | 84,382.8 | 84,143.4 | 83,609.6 | 85,420.7 | 85,423.2 | 83,104.7 | 86,466.5 | 81,588.6 | 81,701.8 | 79,988.9 | 76,685.3 |
| 2008 | 75,231.3 | 78,648.9 | 78,412.7 | 78,717.9 | 78,619.8 | 77,932.0 | 77,377.1 | 77,893.7 | 71,885.3 | 77,843.8 | 74,759.4 | 76,457.6 |
| 2009 | 72,016.3 | 76,153.5 | 76,121.7 | 78,778.1 | 80,243.1 | 81,168.2 | 80,387.7 | 79,832.3 | 77,743.8 | 77,678.1 | 74,722.9 | 76,954.8 |
| 2010 | 72,368.7 | 75,494.0 | 78,260.4 | 79,149.6 | 78,937.9 | 79,037.2 | 79,902.2 | 78,877.4 | 75,830.9 | 74,201.0 | 74,759.5 | 75,081.1 |
| 2011 | 68,284.0 | 73,591.5 | 73,695.6 | 74,607.1 | 74,263.7 | 75,502.0 | 74,934.9 | 76,463.0 | 74,169.0 | 73,717.1 | 74,186.2 | 73,628.3 |
| 2012 | 66,050.0 | 71,085.4 | 72,386.6 | 71,394.6 | 71,511.7 | 72,269.9 | 71,535.0 | 72,660.0 | 68,512.8 | 72,123.1 | 71,131.3 | 68,154.6 |
| 2013 | 66,269.7 | 69,321.8 | 70,443.5 | 71,059.7 | 71,312.7 | 70,299.0 | 69,242.6 | 71,883.6 | 70,027.3 | 71,494.8 | 70,743.2 | 69,700.9 |
| 2014 | 66,282.8 | 68,762.3 | 71,044.9 | 71,561.6 | 73,354.2 | 72,457.2 | 73,101.6 | 72,900.8 | 69,732.2 | 72,110.5 | 70,918.2 | 70,755.2 |
| 2015 | 68,307.8 | 71,787.1 | 72,541.7 | 74,642.5 | 73,911.1 | 75,076.4 | 75,208.7 | 74,529.1 | 72,237.9 | 72,222.1 | 72,304.1 | 72,291.7 |
| 2016 | 68,566.5 | 73,349.8 | 75,277.0 | 75,276.4 | 75,387.6 | 77,670.1 | 77,139.5 | 76,281.5 | 72,993.9 | 74,075.4 | 73,599.3 | 73,410.8 |
| 2017 | 68,668.8 | 72,503.7 | 75,690.8 | 76,377.7 | 76,480.3 | 77,638.8 | 76,492.7 | 79,289.9 | 74,328.5 | 75,828.6 | 74,775.7 | 72,683.2 |
| 2018 | 68,327.0 | 71,464.1 | 75,628.9 | 75,253.6 | 76,960.2 | 78,051.8 | 77,105.5 | 78,782.6 | 74,756.3 | 76,606.5 | 74,839.7 | 72,565.6 |
| 2019 | 69,347.8 | 71,171.3 | 73,466.0 | 73,995.6 | 76,894.5 | 74,447.1 | 75,446.8 | 78,241.5 | 71,847.7 | 75,410.9 | 73,860.5 | 72,113.5 |
| 2020 | 70,272.4 | 72,562.3 | 64,687.8 | 46,391.7 | 58,985.3 | 67,907.9 | 72,805.6 | 71,679.6 | 71,365.0 | 71,720.7 | 68,254.2 | 68,301.2 |
| 2021 | 65,958.7 | 68,284.5 | 74,144.4 | 76,185.4 | 77,067.9 | 78,100.5 | 78,221.6 | 77,705.0 | 74,378.2 | 74,778.2 | 73,974.6 | 72,348.4 |
| 2022 | 65,914.5 | 73,089.3 | 73,756.9 | |||||||||
| - = No Data Reported; -- = Not Applicable; NA = Not Available; W = Withheld to avoid disclosure of individual company data. |
| Release Date: 5/19/2022 |
| Next Release Date: TBD |