|
Download Data (XLS File) |
|
||||||||
|
||||||||
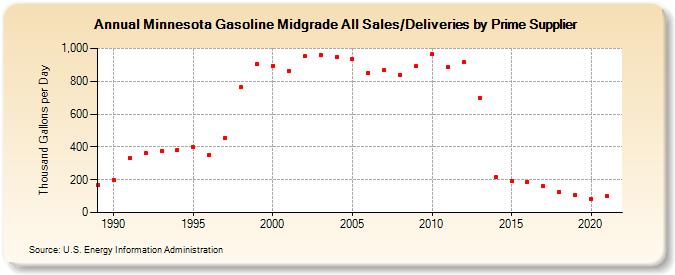
| Minnesota Gasoline Midgrade All Sales/Deliveries by Prime Supplier (Thousand Gallons per Day) | ||||||||
| Decade | Year-0 | Year-1 | Year-2 | Year-3 | Year-4 | Year-5 | Year-6 | Year-7 | Year-8 | Year-9 |
|---|---|---|---|---|---|---|---|---|---|---|
| 1980's | 165.2 | |||||||||
| 1990's | 201.1 | 332.9 | 360.1 | 375.1 | 382.6 | 396.6 | 353.6 | 456.4 | 762.7 | 904.9 |
| 2000's | 895.3 | 865.2 | 953.5 | 961.5 | 947.1 | 933.6 | 850.2 | 866.3 | 840.0 | 890.8 |
| 2010's | 964.6 | 884.2 | 914.4 | 699.8 | 213.7 | 193.0 | 188.2 | 160.7 | 126.3 | 105.2 |
| 2020's | 83.5 |
| - = No Data Reported; -- = Not Applicable; NA = Not Available; W = Withheld to avoid disclosure of individual company data. |
| Release Date: 6/1/2022 |
| Next Release Date: TBD |