|
Download Data (XLS File) |
|
||||||||
|
||||||||
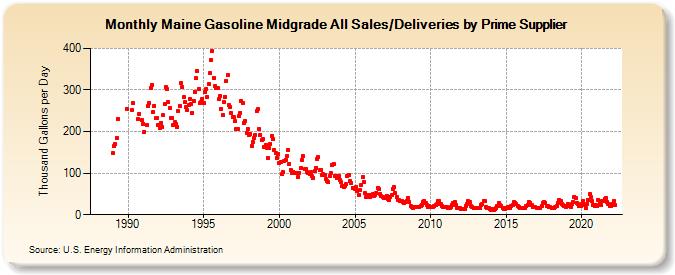
| Maine Gasoline Midgrade All Sales/Deliveries by Prime Supplier (Thousand Gallons per Day) | ||||||||
| Year | Jan | Feb | Mar | Apr | May | Jun | Jul | Aug | Sep | Oct | Nov | Dec |
|---|---|---|---|---|---|---|---|---|---|---|---|---|
| 1988 | NA | NA | NA | NA | NA | NA | NA | NA | NA | NA | NA | NA |
| 1989 | 148.4 | 165.6 | 169.5 | 185.3 | 230.4 | W | W | W | W | W | W | 254.3 |
| 1990 | W | W | W | 252.6 | 267.5 | W | W | W | 230.8 | 243.4 | W | 226.8 |
| 1991 | 218.8 | 199.6 | W | 215.1 | 260.6 | 269.7 | 304.8 | 312.8 | 246.0 | 261.5 | 231.4 | 232.1 |
| 1992 | 216.2 | 207.4 | 220.9 | 210.4 | 238.7 | 265.2 | 306.8 | 301.6 | 270.2 | 255.5 | 233.2 | 233.7 |
| 1993 | 215.0 | 222.1 | 218.3 | 210.3 | 249.9 | 260.7 | 316.3 | 306.8 | 282.0 | 270.1 | 259.4 | 251.7 |
| 1994 | 263.8 | 278.2 | 265.7 | 245.2 | 274.6 | 296.3 | 327.8 | 346.5 | 302.7 | 269.8 | 272.0 | 279.3 |
| 1995 | 267.6 | 294.4 | 302.8 | 283.1 | 314.2 | 340.0 | 373.1 | 394.5 | 328.1 | 309.1 | 304.4 | 303.9 |
| 1996 | 277.3 | 285.6 | 255.3 | 238.9 | 271.3 | 284.1 | 321.4 | 335.9 | 263.7 | 259.5 | 244.5 | 235.4 |
| 1997 | 234.3 | 224.5 | 205.0 | 205.0 | 236.8 | 245.7 | 272.6 | 268.8 | 221.0 | 225.3 | 196.7 | 205.7 |
| 1998 | 191.6 | 194.4 | 165.8 | 175.2 | 185.2 | 191.4 | 249.4 | 253.6 | 205.8 | 192.6 | 179.6 | 182.6 |
| 1999 | 163.0 | 168.5 | 161.0 | 136.2 | 160.1 | 170.6 | 189.8 | 181.8 | 155.7 | 148.8 | 137.5 | 146.9 |
| 2000 | 124.1 | 126.6 | 96.9 | 102.1 | 129.5 | 131.7 | 141.4 | 156.5 | 122.5 | 108.6 | 100.1 | 103.5 |
| 2001 | 100.5 | 99.4 | 99.6 | 90.7 | 101.5 | 112.2 | 132.1 | 140.2 | 108.9 | 109.0 | 102.9 | 101.5 |
| 2002 | 97.4 | 101.6 | 92.3 | 88.3 | 104.6 | 113.4 | 135.1 | 138.1 | 106.9 | 107.8 | 96.3 | 97.1 |
| 2003 | 94.9 | 86.7 | 81.4 | 77.9 | 93.4 | 99.7 | 120.5 | 122.9 | 92.1 | 93.5 | 88.9 | 94.3 |
| 2004 | 82.9 | 77.9 | 69.7 | 65.9 | 70.1 | 74.3 | 93.6 | 96.1 | 80.5 | 75.7 | 65.0 | 64.2 |
| 2005 | 62.8 | 66.3 | 58.1 | 48.4 | 60.3 | 70.4 | 90.5 | 78.8 | 51.2 | 41.9 | 47.1 | 47.7 |
| 2006 | 42.5 | 48.6 | 49.5 | 43.9 | 48.3 | 53.3 | 64.5 | 62.4 | 50.7 | 44.8 | 42.2 | 40.2 |
| 2007 | 40.5 | 45.8 | 38.3 | 36.5 | 41.8 | 47.1 | 61.2 | 66.3 | 52.0 | 42.5 | 34.9 | 34.9 |
| 2008 | 32.0 | 32.8 | 31.6 | 28.1 | 30.9 | 33.6 | 41.1 | 30.7 | 21.9 | 19.6 | 17.0 | 18.5 |
| 2009 | 19.1 | 19.6 | 18.2 | 18.4 | 21.8 | 22.9 | 30.4 | 31.9 | 27.5 | 23.0 | 19.5 | 20.4 |
| 2010 | 18.4 | 18.6 | 18.4 | 19.9 | 23.5 | 25.7 | 32.3 | 32.8 | 25.7 | 20.8 | 18.9 | 19.2 |
| 2011 | 18.3 | 18.1 | 17.0 | 15.6 | 18.8 | 23.0 | 29.0 | 29.6 | 22.3 | 17.2 | 15.5 | 15.4 |
| 2012 | 13.5 | 14.3 | 13.4 | 13.1 | 22.1 | 24.7 | 32.0 | 30.0 | 21.6 | 18.4 | 16.8 | 16.5 |
| 2013 | 15.8 | 16.1 | 15.9 | 16.3 | 22.6 | 24.8 | 33.5 | 32.8 | 19.0 | 16.7 | 15.0 | 14.5 |
| 2014 | 12.0 | 13.0 | 12.4 | 12.7 | 15.9 | 21.4 | 28.4 | 24.4 | 21.4 | 15.2 | 14.2 | 13.5 |
| 2015 | 15.9 | 17.4 | 15.7 | 17.1 | 21.3 | 24.2 | 30.0 | 29.2 | 25.0 | 20.4 | 18.3 | 17.1 |
| 2016 | 15.3 | 15.6 | 15.4 | 17.3 | 20.2 | 24.3 | 31.3 | 29.0 | 23.4 | 19.2 | 18.1 | 18.2 |
| 2017 | 16.5 | 17.1 | 16.9 | 16.7 | 20.0 | 27.1 | 30.0 | 28.9 | 21.6 | 21.3 | 17.5 | 17.7 |
| 2018 | 16.5 | 15.9 | 16.0 | 17.4 | 21.9 | 27.2 | 36.4 | 34.1 | 26.2 | 22.3 | 19.9 | 19.4 |
| 2019 | 21.9 | 25.0 | 21.8 | 18.7 | 25.3 | 31.1 | 43.4 | 40.6 | 29.1 | 25.3 | 21.6 | 20.3 |
| 2020 | 25.0 | 34.0 | 24.4 | 17.2 | 25.8 | 36.4 | 48.9 | 43.1 | 32.3 | 24.4 | 20.5 | 22.6 |
| 2021 | 20.8 | 35.1 | 27.2 | 22.4 | 32.4 | 33.9 | 38.5 | 40.4 | 31.1 | 26.5 | 20.8 | 20.2 |
| 2022 | 26.0 | 33.1 | 22.8 | |||||||||
| - = No Data Reported; -- = Not Applicable; NA = Not Available; W = Withheld to avoid disclosure of individual company data. |
| Release Date: 5/19/2022 |
| Next Release Date: TBD |