|
Download Data (XLS File) |
|
||||||||
|
||||||||
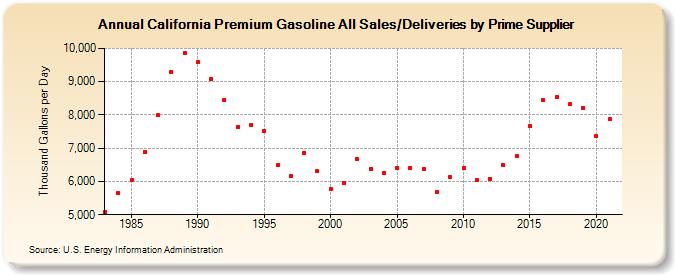
| California Premium Gasoline All Sales/Deliveries by Prime Supplier (Thousand Gallons per Day) | ||||||||
| Decade | Year-0 | Year-1 | Year-2 | Year-3 | Year-4 | Year-5 | Year-6 | Year-7 | Year-8 | Year-9 |
|---|---|---|---|---|---|---|---|---|---|---|
| 1980's | 5,091.1 | 5,646.5 | 6,031.8 | 6,885.7 | 7,987.0 | 9,288.9 | 9,867.4 | |||
| 1990's | 9,589.7 | 9,073.3 | 8,461.8 | 7,650.3 | 7,697.0 | 7,514.8 | 6,488.1 | 6,170.3 | 6,860.5 | 6,302.7 |
| 2000's | 5,771.1 | 5,962.7 | 6,668.3 | 6,386.9 | 6,256.5 | 6,416.0 | 6,418.4 | 6,379.3 | 5,686.8 | 6,121.1 |
| 2010's | 6,391.4 | 6,031.2 | 6,076.5 | 6,490.3 | 6,763.1 | 7,655.8 | 8,444.3 | 8,525.8 | 8,316.8 | 8,217.2 |
| 2020's | 7,356.3 |
| - = No Data Reported; -- = Not Applicable; NA = Not Available; W = Withheld to avoid disclosure of individual company data. |
| Release Date: 6/1/2022 |
| Next Release Date: TBD |