|
Download Data (XLS File) |
|
||||||||
|
||||||||
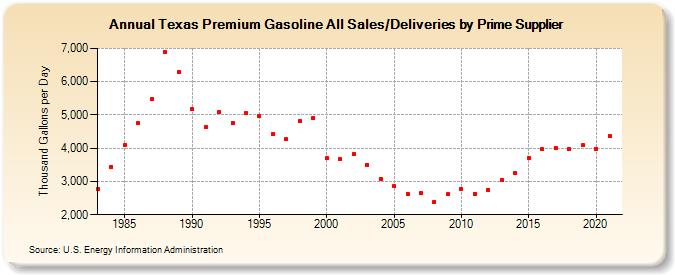
| Texas Premium Gasoline All Sales/Deliveries by Prime Supplier (Thousand Gallons per Day) | ||||||||
| Decade | Year-0 | Year-1 | Year-2 | Year-3 | Year-4 | Year-5 | Year-6 | Year-7 | Year-8 | Year-9 |
|---|---|---|---|---|---|---|---|---|---|---|
| 1980's | 2,776.0 | 3,436.0 | 4,095.6 | 4,747.5 | 5,470.8 | 6,889.9 | 6,283.4 | |||
| 1990's | 5,167.8 | 4,631.9 | 5,086.5 | 4,759.7 | 5,052.2 | 4,954.5 | 4,431.5 | 4,266.6 | 4,812.3 | 4,909.6 |
| 2000's | 3,695.4 | 3,662.3 | 3,830.6 | 3,504.4 | 3,075.0 | 2,854.3 | 2,631.7 | 2,655.2 | 2,394.8 | 2,617.6 |
| 2010's | 2,766.6 | 2,631.1 | 2,757.4 | 3,055.9 | 3,246.1 | 3,708.6 | 3,967.9 | 4,019.1 | 3,967.6 | 4,084.2 |
| 2020's | 3,981.2 |
| - = No Data Reported; -- = Not Applicable; NA = Not Available; W = Withheld to avoid disclosure of individual company data. |
| Release Date: 6/1/2022 |
| Next Release Date: TBD |