|
Download Data (XLS File) |
|
||||||||
|
||||||||
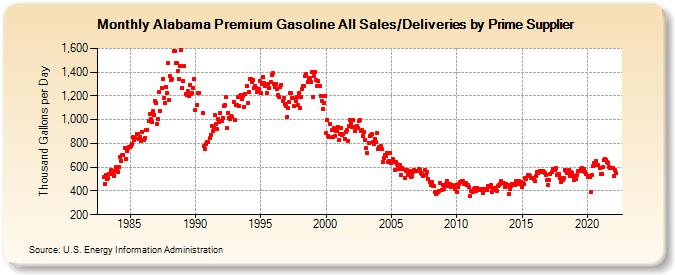
| Alabama Premium Gasoline All Sales/Deliveries by Prime Supplier (Thousand Gallons per Day) | ||||||||
| Year | Jan | Feb | Mar | Apr | May | Jun | Jul | Aug | Sep | Oct | Nov | Dec |
|---|---|---|---|---|---|---|---|---|---|---|---|---|
| 1983 | 516.7 | 460.0 | 531.5 | 503.6 | 513.2 | 546.9 | 538.9 | 579.4 | 541.1 | 529.6 | 569.2 | 598.1 |
| 1984 | 576.4 | 563.0 | 599.0 | 682.0 | 654.6 | 706.4 | 698.6 | 761.7 | 668.7 | 737.4 | 764.8 | 767.1 |
| 1985 | 769.1 | 778.9 | 799.1 | 850.0 | 830.9 | 849.1 | 881.0 | 876.1 | 840.0 | 854.2 | 821.9 | 899.1 |
| 1986 | 824.8 | 832.4 | 845.4 | 917.1 | 915.0 | 988.4 | 1,043.7 | 1,009.3 | 979.4 | 1,069.0 | 1,042.8 | 1,154.0 |
| 1987 | 1,143.6 | 964.8 | 1,005.4 | 1,232.9 | 1,073.2 | 1,266.9 | 1,339.2 | 1,184.2 | 1,143.4 | 1,274.7 | 1,225.2 | 1,473.3 |
| 1988 | 1,166.2 | 1,364.8 | 1,331.6 | 1,344.6 | 1,578.6 | 1,575.6 | 1,478.8 | 1,473.8 | 1,408.3 | 1,339.2 | 1,454.8 | 1,586.5 |
| 1989 | 1,265.7 | 1,327.8 | 1,449.7 | 1,218.2 | 1,209.1 | 1,238.9 | 1,200.2 | 1,293.8 | 1,219.7 | 1,222.8 | 1,262.8 | 1,343.5 |
| 1990 | 1,079.9 | 1,119.9 | 1,221.3 | 1,228.0 | W | W | W | 1,057.3 | 775.2 | 751.5 | 795.4 | 812.3 |
| 1991 | 809.9 | 843.1 | 873.9 | 949.4 | 904.5 | 931.8 | 1,038.2 | 961.9 | 924.3 | 1,005.1 | 980.6 | 1,058.2 |
| 1992 | 991.1 | 1,017.9 | 1,112.6 | 1,125.7 | 1,188.4 | 928.0 | 1,058.1 | 1,014.3 | 1,007.4 | 1,029.3 | 1,019.4 | 1,151.1 |
| 1993 | 994.6 | 1,122.6 | 1,126.0 | 1,189.8 | 1,117.8 | 1,199.0 | 1,209.8 | 1,172.5 | 1,203.2 | 1,108.4 | 1,215.7 | 1,283.5 |
| 1994 | 1,142.8 | 1,234.4 | 1,344.6 | 1,344.8 | 1,319.2 | 1,338.0 | 1,263.8 | 1,286.4 | 1,270.7 | 1,235.7 | 1,254.9 | 1,327.8 |
| 1995 | 1,223.0 | 1,302.6 | 1,362.8 | 1,310.6 | 1,279.5 | 1,285.7 | 1,225.4 | 1,303.1 | 1,270.3 | 1,315.9 | 1,376.3 | 1,397.0 |
| 1996 | 1,300.6 | 1,278.1 | 1,300.1 | 1,261.4 | 1,209.7 | 1,192.5 | 1,271.5 | 1,296.0 | 1,156.6 | 1,180.3 | 1,134.4 | 1,116.3 |
| 1997 | 1,021.0 | 1,095.5 | 1,147.2 | 1,226.7 | 1,222.2 | 1,180.9 | 1,181.6 | 1,114.0 | 1,154.2 | 1,192.1 | 1,125.2 | 1,227.7 |
| 1998 | 1,096.8 | 1,193.3 | 1,261.5 | 1,281.0 | 1,285.6 | 1,370.1 | 1,385.2 | 1,318.0 | 1,352.3 | 1,352.1 | 1,314.5 | 1,402.5 |
| 1999 | 1,191.1 | 1,364.6 | 1,401.8 | 1,332.6 | 1,283.3 | 1,326.8 | 1,287.6 | 1,202.8 | 1,159.1 | 1,088.8 | 1,137.0 | 1,202.5 |
| 2000 | 884.0 | 998.2 | 863.6 | 853.8 | 962.6 | 910.3 | 851.9 | 928.8 | 862.3 | 908.7 | 906.2 | 936.8 |
| 2001 | 826.9 | 882.8 | 926.6 | 871.9 | 882.4 | 838.4 | 899.4 | 910.8 | 820.9 | 947.9 | 1,000.1 | 974.2 |
| 2002 | 935.7 | 999.4 | 937.5 | 904.0 | 948.7 | 925.8 | 985.3 | 997.0 | 902.5 | 909.3 | 861.8 | 897.5 |
| 2003 | 828.8 | 757.5 | 723.3 | 807.2 | 862.8 | 867.5 | 876.8 | 811.4 | 794.2 | 838.0 | 815.0 | 885.3 |
| 2004 | 752.8 | 768.9 | 779.0 | 752.7 | 644.5 | 676.4 | 701.3 | 690.7 | 719.6 | 647.6 | 650.0 | 716.5 |
| 2005 | 632.5 | 672.9 | 641.6 | 575.2 | 644.7 | 625.5 | 610.2 | 582.5 | 615.5 | 533.5 | 592.9 | 581.1 |
| 2006 | 508.2 | 570.9 | 578.2 | 537.7 | 541.5 | 565.2 | 517.0 | 523.4 | 558.9 | 577.8 | 570.7 | 565.8 |
| 2007 | 563.9 | 585.0 | 579.6 | 554.2 | 539.0 | 527.9 | 536.2 | 577.5 | 535.7 | 559.0 | 497.3 | 478.6 |
| 2008 | 451.3 | 474.3 | 442.1 | 439.3 | 393.2 | 373.8 | 385.9 | 393.1 | 398.4 | 465.9 | 406.5 | 454.1 |
| 2009 | 413.5 | 448.8 | 460.5 | 482.5 | 443.5 | 451.3 | 460.6 | 435.8 | 447.2 | 444.9 | 418.7 | 446.6 |
| 2010 | 389.9 | 430.3 | 455.8 | 474.0 | 474.3 | 480.1 | 483.3 | 462.3 | 467.3 | 448.8 | 446.7 | 431.7 |
| 2011 | 358.5 | 403.1 | 396.5 | 391.5 | 413.3 | 426.2 | 399.7 | 422.3 | 418.1 | 408.8 | 411.3 | 413.5 |
| 2012 | 380.9 | 415.4 | 404.5 | 415.2 | 407.3 | 439.2 | 433.9 | 449.5 | 390.4 | 423.6 | 425.7 | 427.2 |
| 2013 | 410.1 | 398.2 | 438.0 | 452.4 | 456.5 | 480.6 | 463.0 | 468.6 | 431.9 | 460.1 | 440.0 | 448.0 |
| 2014 | 374.9 | 415.8 | 441.9 | 455.6 | 458.6 | 452.4 | 480.3 | 462.9 | 459.3 | 483.1 | 466.1 | 474.3 |
| 2015 | 436.1 | 464.0 | 461.0 | 505.2 | 499.1 | 531.1 | 532.6 | 523.1 | 511.9 | 506.0 | 509.0 | 502.7 |
| 2016 | 481.3 | 523.2 | 555.4 | 550.6 | 565.5 | 563.8 | 556.1 | 564.0 | 562.6 | 552.7 | 536.9 | 488.4 |
| 2017 | 451.9 | 492.2 | 541.4 | 559.6 | 583.1 | 572.2 | 577.9 | 593.8 | 534.3 | 546.1 | 545.7 | 506.6 |
| 2018 | 476.9 | 494.0 | 512.8 | 577.5 | 570.1 | 548.4 | 563.1 | 573.8 | 529.3 | 557.1 | 553.0 | 528.7 |
| 2019 | 494.6 | 501.7 | 531.2 | 564.3 | 569.9 | 565.4 | 585.1 | 589.9 | 567.2 | 581.5 | 558.5 | 544.9 |
| 2020 | 514.9 | 526.8 | 519.6 | 390.4 | 534.5 | 605.9 | 635.1 | 631.9 | 652.4 | 621.1 | 615.9 | 591.9 |
| 2021 | 545.4 | 546.0 | 598.4 | 656.9 | 669.0 | 663.3 | 647.9 | 639.4 | 602.2 | 596.6 | 594.9 | 592.7 |
| 2022 | 525.4 | 572.6 | 552.6 | |||||||||
| - = No Data Reported; -- = Not Applicable; NA = Not Available; W = Withheld to avoid disclosure of individual company data. |
| Release Date: 5/19/2022 |
| Next Release Date: TBD |