|
Download Data (XLS File) |
|
||||||||
|
||||||||
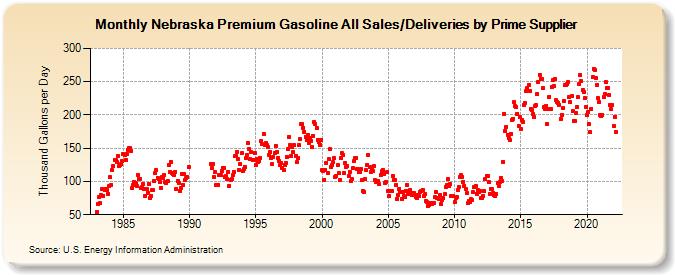
| Nebraska Premium Gasoline All Sales/Deliveries by Prime Supplier (Thousand Gallons per Day) | ||||||||
| Year | Jan | Feb | Mar | Apr | May | Jun | Jul | Aug | Sep | Oct | Nov | Dec |
|---|---|---|---|---|---|---|---|---|---|---|---|---|
| 1983 | 54.5 | 66.8 | 76.1 | 67.1 | 79.8 | 88.7 | 78.7 | 87.0 | 89.4 | 87.5 | 81.8 | 92.6 |
| 1984 | 106.0 | 95.1 | 117.0 | 123.0 | 132.6 | 131.5 | 129.9 | 138.3 | 123.0 | 125.3 | 126.6 | 130.6 |
| 1985 | 141.1 | 139.5 | 132.4 | 141.9 | 147.4 | 150.0 | 150.0 | 146.3 | 89.5 | 94.5 | 98.8 | 97.5 |
| 1986 | 93.2 | 110.3 | 104.1 | 104.0 | 90.5 | 91.1 | 96.5 | 88.8 | 78.6 | 89.0 | 83.2 | 95.8 |
| 1987 | 75.0 | 78.5 | 86.6 | 86.9 | 100.5 | 112.0 | 116.6 | 105.6 | 103.0 | 98.5 | 90.6 | 106.9 |
| 1988 | 105.0 | 109.1 | 99.9 | 98.2 | 100.8 | 124.3 | 114.7 | 129.5 | 112.8 | 111.9 | 110.2 | 114.8 |
| 1989 | 88.5 | 100.9 | 98.2 | 85.7 | 90.3 | 111.1 | 94.7 | 111.1 | 102.8 | 105.4 | 107.4 | 121.9 |
| 1990 | W | W | W | W | W | W | W | W | W | W | W | W |
| 1991 | W | W | W | W | W | W | W | 126.0 | 119.9 | 126.7 | 106.8 | 114.0 |
| 1992 | 95.4 | 95.4 | 95.4 | 109.8 | 109.6 | 116.2 | 120.9 | 120.5 | 107.0 | 108.5 | 103.1 | 114.7 |
| 1993 | 93.7 | 102.4 | 103.6 | 109.2 | 114.8 | 137.8 | 138.7 | 145.0 | 133.1 | 117.8 | 125.9 | 142.3 |
| 1994 | 115.6 | 118.3 | 122.3 | 134.5 | 140.2 | 158.2 | 149.0 | 133.8 | 143.9 | 131.7 | 132.6 | 143.4 |
| 1995 | 125.2 | 134.3 | 129.4 | 130.5 | 135.8 | 160.5 | 155.8 | 172.0 | 155.0 | 158.1 | 154.3 | 151.8 |
| 1996 | 139.9 | 144.5 | 135.0 | 126.1 | 136.7 | 143.2 | 153.7 | 144.6 | 135.1 | 131.4 | 124.6 | 127.5 |
| 1997 | 120.5 | 116.7 | 124.4 | 128.1 | 137.1 | 148.2 | 167.2 | 155.5 | 138.1 | 151.3 | 143.6 | 154.3 |
| 1998 | 138.4 | 128.6 | 135.3 | 154.2 | 163.2 | 186.1 | 185.7 | 180.9 | 174.8 | 167.2 | 162.5 | 170.2 |
| 1999 | 158.2 | 164.8 | 160.6 | 151.1 | 169.0 | 189.5 | 186.0 | 180.7 | 162.7 | 159.1 | 154.5 | 162.2 |
| 2000 | 117.4 | 116.2 | 102.8 | 117.7 | 128.3 | 112.7 | 133.0 | 148.5 | 121.5 | 124.5 | 128.6 | 134.7 |
| 2001 | 106.3 | 108.1 | 124.1 | 112.5 | 102.2 | 134.5 | 142.3 | 139.5 | 112.6 | 128.1 | 122.0 | 123.3 |
| 2002 | 108.3 | 114.3 | 100.6 | 103.0 | 119.6 | 130.1 | 134.5 | 135.5 | 119.3 | 113.9 | 114.8 | 118.8 |
| 2003 | 101.5 | 84.9 | 84.6 | 103.3 | 116.7 | 125.3 | 139.7 | 121.6 | 113.9 | 119.1 | 115.4 | 123.0 |
| 2004 | 102.3 | 98.7 | 99.6 | 100.8 | 95.5 | 109.4 | 115.0 | 117.3 | 110.9 | 98.1 | 99.9 | 113.5 |
| 2005 | 85.1 | 78.2 | 84.9 | 85.7 | 108.3 | 101.9 | 101.9 | 95.1 | 74.2 | 79.8 | 89.3 | 84.5 |
| 2006 | 74.2 | 84.5 | 77.4 | 76.1 | 86.1 | 95.4 | 81.2 | 84.4 | 86.8 | 79.0 | 82.2 | 82.4 |
| 2007 | 79.6 | 76.6 | 75.8 | 80.2 | 77.7 | 83.4 | 85.3 | 87.3 | 78.2 | 80.7 | 70.5 | 69.5 |
| 2008 | 63.5 | 65.2 | 68.2 | 66.9 | 66.8 | 67.1 | 76.0 | 84.3 | 75.3 | 75.2 | 73.3 | 79.0 |
| 2009 | 66.0 | 72.4 | 74.7 | 80.5 | 91.7 | 94.2 | 103.0 | 93.0 | 95.7 | 77.4 | 78.8 | 77.5 |
| 2010 | 69.4 | 75.6 | 77.2 | 86.5 | 92.2 | 106.1 | 109.5 | 107.4 | 99.7 | 93.1 | 89.3 | 82.1 |
| 2011 | 67.1 | 70.3 | 69.2 | 73.2 | 72.4 | 83.6 | 91.7 | 93.5 | 81.7 | 87.3 | 83.6 | 85.5 |
| 2012 | 74.7 | 75.2 | 78.1 | 85.0 | 103.0 | 108.3 | 107.9 | 99.1 | 81.6 | 89.2 | 87.9 | 83.3 |
| 2013 | 80.3 | 77.9 | 81.0 | 97.3 | 93.2 | 98.8 | 105.7 | 101.4 | 129.8 | 201.9 | 176.1 | 182.4 |
| 2014 | 170.2 | 164.6 | 162.5 | 171.8 | 192.4 | 194.3 | 219.0 | 213.2 | 211.5 | 201.5 | 183.5 | 197.3 |
| 2015 | 178.6 | 192.1 | 189.8 | 215.3 | 217.7 | 235.3 | 240.8 | 244.8 | 236.4 | 209.3 | 206.7 | 201.9 |
| 2016 | 197.5 | 213.0 | 214.8 | 230.8 | 250.2 | 260.7 | 254.4 | 253.9 | 239.9 | 211.9 | 209.1 | 213.8 |
| 2017 | 186.5 | 209.3 | 227.4 | 209.6 | 241.4 | 251.8 | 243.7 | 254.6 | 221.9 | 220.0 | 218.4 | 215.6 |
| 2018 | 194.2 | 199.7 | 209.9 | 220.9 | 244.5 | 245.6 | 246.1 | 248.8 | 227.1 | 219.3 | 227.9 | 205.5 |
| 2019 | 191.1 | 191.0 | 203.1 | 212.0 | 226.5 | 246.4 | 259.9 | 250.5 | 237.2 | 234.0 | 225.0 | 212.3 |
| 2020 | 199.2 | 205.1 | 185.7 | 173.6 | 209.5 | 256.3 | 269.6 | 267.8 | 255.6 | 245.5 | 224.9 | 219.6 |
| 2021 | 200.1 | 198.3 | 200.0 | 226.6 | 231.5 | 248.8 | 241.1 | 241.0 | 229.6 | 215.6 | 208.3 | 214.8 |
| 2022 | 183.6 | 197.6 | 174.6 | |||||||||
| - = No Data Reported; -- = Not Applicable; NA = Not Available; W = Withheld to avoid disclosure of individual company data. |
| Release Date: 5/19/2022 |
| Next Release Date: TBD |