|
Download Data (XLS File) |
|
||||||||
|
||||||||
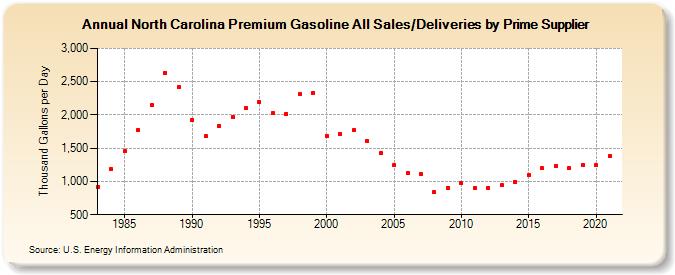
| North Carolina Premium Gasoline All Sales/Deliveries by Prime Supplier (Thousand Gallons per Day) | ||||||||
| Decade | Year-0 | Year-1 | Year-2 | Year-3 | Year-4 | Year-5 | Year-6 | Year-7 | Year-8 | Year-9 |
|---|---|---|---|---|---|---|---|---|---|---|
| 1980's | 917.6 | 1,184.9 | 1,453.4 | 1,772.3 | 2,145.3 | 2,634.7 | 2,423.1 | |||
| 1990's | 1,930.2 | 1,676.2 | 1,832.7 | 1,966.0 | 2,103.5 | 2,191.5 | 2,026.1 | 2,015.6 | 2,309.7 | 2,331.7 |
| 2000's | 1,688.8 | 1,710.4 | 1,770.0 | 1,607.9 | 1,420.2 | 1,241.0 | 1,122.0 | 1,105.2 | 838.2 | 909.0 |
| 2010's | 975.8 | 902.6 | 902.7 | 945.7 | 995.6 | 1,099.4 | 1,195.6 | 1,229.3 | 1,197.0 | 1,241.8 |
| 2020's | 1,241.8 |
| - = No Data Reported; -- = Not Applicable; NA = Not Available; W = Withheld to avoid disclosure of individual company data. |
| Release Date: 6/1/2022 |
| Next Release Date: TBD |