|
Download Data (XLS File) |
|
||||||||
|
||||||||
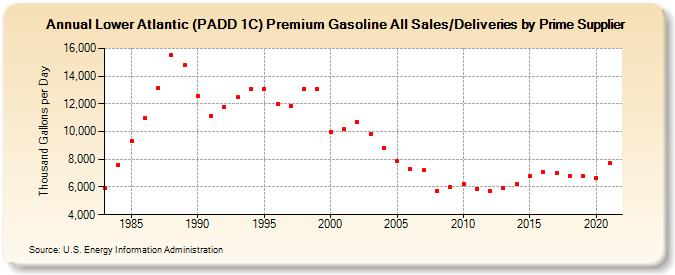
| Lower Atlantic (PADD 1C) Premium Gasoline All Sales/Deliveries by Prime Supplier (Thousand Gallons per Day) | ||||||||
| Decade | Year-0 | Year-1 | Year-2 | Year-3 | Year-4 | Year-5 | Year-6 | Year-7 | Year-8 | Year-9 |
|---|---|---|---|---|---|---|---|---|---|---|
| 1980's | 5,910.8 | 7,570.7 | 9,309.8 | 10,985.5 | 13,147.7 | 15,517.2 | 14,781.1 | |||
| 1990's | 12,578.2 | 11,117.4 | 11,793.1 | 12,497.2 | 13,053.2 | 13,080.1 | 11,975.2 | 11,878.8 | 13,090.2 | 13,055.1 |
| 2000's | 9,964.0 | 10,155.2 | 10,675.7 | 9,836.2 | 8,821.7 | 7,852.7 | 7,296.6 | 7,202.1 | 5,712.9 | 6,027.8 |
| 2010's | 6,184.6 | 5,874.7 | 5,678.1 | 5,901.2 | 6,189.3 | 6,783.8 | 7,050.4 | 6,997.3 | 6,794.1 | 6,781.0 |
| 2020's | 6,664.1 |
| - = No Data Reported; -- = Not Applicable; NA = Not Available; W = Withheld to avoid disclosure of individual company data. |
| Release Date: 6/1/2022 |
| Next Release Date: TBD |