|
Download Data (XLS File) |
|
||||||||
|
||||||||
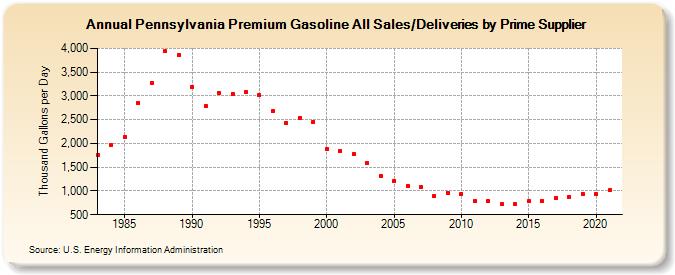
| Pennsylvania Premium Gasoline All Sales/Deliveries by Prime Supplier (Thousand Gallons per Day) | ||||||||
| Decade | Year-0 | Year-1 | Year-2 | Year-3 | Year-4 | Year-5 | Year-6 | Year-7 | Year-8 | Year-9 |
|---|---|---|---|---|---|---|---|---|---|---|
| 1980's | 1,760.7 | 1,968.0 | 2,140.0 | 2,857.0 | 3,279.4 | 3,936.0 | 3,862.0 | |||
| 1990's | 3,189.1 | 2,791.8 | 3,060.2 | 3,041.3 | 3,091.5 | 3,011.5 | 2,685.3 | 2,432.5 | 2,536.1 | 2,456.8 |
| 2000's | 1,875.2 | 1,845.9 | 1,787.3 | 1,586.4 | 1,324.0 | 1,216.8 | 1,106.9 | 1,082.1 | 895.6 | 962.8 |
| 2010's | 943.8 | 793.1 | 782.7 | 719.2 | 720.0 | 782.7 | 795.7 | 849.1 | 882.0 | 945.3 |
| 2020's | 940.2 |
| - = No Data Reported; -- = Not Applicable; NA = Not Available; W = Withheld to avoid disclosure of individual company data. |
| Release Date: 6/1/2022 |
| Next Release Date: TBD |