|
Download Data (XLS File) |
|
||||||||
|
||||||||
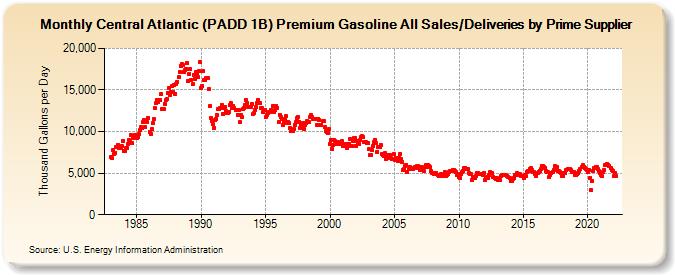
| Central Atlantic (PADD 1B) Premium Gasoline All Sales/Deliveries by Prime Supplier (Thousand Gallons per Day) | ||||||||
| Year | Jan | Feb | Mar | Apr | May | Jun | Jul | Aug | Sep | Oct | Nov | Dec |
|---|---|---|---|---|---|---|---|---|---|---|---|---|
| 1983 | 6,964.5 | 6,764.2 | 7,751.9 | 7,359.3 | 7,453.3 | 8,124.2 | 8,117.4 | 8,439.2 | 8,052.8 | 8,023.7 | 8,279.8 | 8,919.2 |
| 1984 | 7,634.3 | 7,608.4 | 7,999.4 | 7,989.9 | 8,507.8 | 8,939.2 | 8,774.8 | 9,577.6 | 8,597.9 | 9,173.7 | 9,572.3 | 9,353.3 |
| 1985 | 9,226.9 | 9,371.0 | 9,695.7 | 10,138.0 | 10,522.9 | 10,381.2 | 11,108.1 | 11,419.6 | 10,567.4 | 11,211.7 | 11,160.6 | 11,638.9 |
| 1986 | 9,979.2 | 9,715.4 | 10,306.4 | 10,977.8 | 11,482.0 | 12,797.7 | 13,387.1 | 13,800.5 | 13,505.1 | 13,779.1 | 13,771.5 | 14,463.4 |
| 1987 | 12,734.6 | 12,716.9 | 13,323.7 | 13,787.8 | 13,898.6 | 14,685.7 | 15,236.5 | 14,401.9 | 14,755.8 | 15,429.5 | 14,743.6 | 15,561.3 |
| 1988 | 14,564.2 | 15,772.2 | 15,963.7 | 16,519.7 | 17,165.3 | 17,920.0 | 18,088.9 | 18,028.3 | 17,207.9 | 17,351.2 | 17,526.6 | 18,257.2 |
| 1989 | 16,138.5 | 16,962.4 | 17,533.0 | 16,207.4 | 15,686.7 | 16,808.8 | 16,319.6 | 17,190.3 | 16,930.3 | 16,579.1 | 17,272.0 | 18,334.2 |
| 1990 | 15,240.9 | 15,514.9 | 17,243.8 | 16,168.5 | 16,206.5 | 16,490.2 | 16,444.6 | 15,064.4 | 13,025.4 | 11,622.5 | 11,241.6 | 10,866.9 |
| 1991 | 10,473.9 | 11,384.8 | 11,546.1 | 11,930.3 | 12,763.4 | 12,760.1 | 12,813.0 | 13,226.1 | 12,157.2 | 12,786.7 | 12,984.2 | 12,438.7 |
| 1992 | 12,264.2 | 12,217.4 | 12,355.2 | 13,146.8 | 13,376.7 | 12,819.7 | 13,127.8 | 12,810.8 | 12,552.9 | 12,641.4 | 12,040.6 | 12,575.0 |
| 1993 | 11,137.6 | 11,990.1 | 11,762.1 | 12,702.5 | 12,855.3 | 13,230.5 | 13,744.1 | 13,450.1 | 12,952.8 | 12,963.8 | 12,942.6 | 13,357.1 |
| 1994 | 12,051.7 | 12,223.8 | 12,579.2 | 13,007.3 | 13,401.5 | 13,804.4 | 13,468.8 | 13,390.7 | 12,838.6 | 12,816.9 | 12,333.9 | 12,635.0 |
| 1995 | 11,702.8 | 12,007.9 | 12,272.4 | 12,345.9 | 12,352.7 | 12,614.7 | 12,418.6 | 13,050.0 | 12,387.7 | 12,555.5 | 13,055.3 | 12,878.6 |
| 1996 | 11,096.5 | 12,025.4 | 11,782.1 | 11,502.4 | 10,806.4 | 11,188.1 | 11,476.5 | 11,836.4 | 11,063.8 | 11,180.0 | 11,025.7 | 10,483.0 |
| 1997 | 10,111.6 | 10,034.9 | 10,278.2 | 10,837.3 | 11,124.1 | 11,595.6 | 11,809.5 | 11,189.8 | 10,450.4 | 10,730.0 | 10,562.5 | 11,045.4 |
| 1998 | 10,268.8 | 10,776.1 | 11,086.3 | 11,210.0 | 11,128.2 | 11,720.5 | 11,966.0 | 11,766.5 | 11,506.3 | 11,518.9 | 11,511.9 | 11,518.4 |
| 1999 | 10,825.3 | 11,541.5 | 11,438.4 | 10,729.9 | 10,813.6 | 11,214.9 | 11,230.8 | 10,520.5 | 10,029.9 | 9,955.5 | 9,882.1 | 10,291.7 |
| 2000 | 8,556.0 | 9,033.8 | 7,943.5 | 8,395.8 | 8,943.7 | 8,841.3 | 8,466.6 | 8,690.0 | 8,510.0 | 8,666.3 | 8,544.7 | 8,839.6 |
| 2001 | 8,222.6 | 8,319.8 | 8,487.5 | 8,530.5 | 7,991.4 | 8,245.9 | 8,543.7 | 9,083.6 | 8,322.4 | 8,867.4 | 9,171.6 | 9,197.0 |
| 2002 | 8,263.8 | 8,819.6 | 8,693.7 | 8,536.0 | 8,940.9 | 9,366.1 | 9,437.1 | 9,373.1 | 8,745.9 | 8,787.2 | 8,681.1 | 8,590.9 |
| 2003 | 7,857.0 | 7,130.1 | 7,217.9 | 7,790.6 | 8,292.4 | 8,697.3 | 9,039.5 | 8,612.6 | 7,582.3 | 8,153.5 | 8,183.7 | 8,391.9 |
| 2004 | 7,324.7 | 7,226.1 | 7,091.5 | 7,387.8 | 6,726.3 | 6,855.8 | 7,151.8 | 7,152.0 | 7,185.0 | 6,762.2 | 6,705.1 | 7,275.5 |
| 2005 | 6,622.2 | 6,850.6 | 6,568.8 | 6,456.3 | 6,853.4 | 7,291.5 | 6,719.8 | 6,320.3 | 5,410.2 | 5,453.2 | 5,873.9 | 5,997.4 |
| 2006 | 5,107.5 | 5,477.6 | 5,728.0 | 5,482.4 | 5,502.7 | 5,552.9 | 5,625.0 | 5,695.6 | 5,637.4 | 5,857.9 | 5,824.7 | 5,687.8 |
| 2007 | 5,409.8 | 5,754.5 | 5,328.9 | 5,244.4 | 5,718.5 | 5,943.1 | 5,730.5 | 6,005.9 | 5,844.0 | 5,717.6 | 5,209.7 | 5,065.4 |
| 2008 | 4,978.0 | 4,841.6 | 4,849.9 | 5,019.0 | 4,809.6 | 4,667.5 | 4,743.2 | 4,847.4 | 4,608.5 | 4,755.9 | 4,847.3 | 5,104.8 |
| 2009 | 4,681.0 | 4,832.7 | 4,885.5 | 5,146.5 | 5,290.1 | 5,242.9 | 5,404.0 | 5,436.7 | 5,248.1 | 5,184.9 | 4,776.3 | 4,878.2 |
| 2010 | 4,580.5 | 4,398.3 | 4,845.0 | 5,102.9 | 5,284.5 | 5,595.0 | 5,649.8 | 5,456.6 | 5,475.0 | 5,015.9 | 4,906.6 | 4,854.1 |
| 2011 | 4,234.0 | 4,522.8 | 4,481.1 | 4,372.9 | 4,698.2 | 5,032.5 | 5,002.5 | 4,942.0 | 4,849.7 | 4,837.2 | 4,834.5 | 4,995.7 |
| 2012 | 4,232.0 | 4,398.7 | 4,495.5 | 4,464.6 | 4,791.0 | 5,109.2 | 5,018.1 | 4,987.9 | 4,559.3 | 4,445.1 | 4,270.6 | 4,419.9 |
| 2013 | 4,157.2 | 4,224.0 | 4,202.7 | 4,642.3 | 4,745.0 | 4,822.4 | 4,824.9 | 4,819.5 | 4,727.8 | 4,642.5 | 4,545.4 | 4,377.5 |
| 2014 | 4,010.3 | 4,092.8 | 4,259.2 | 4,421.1 | 4,731.6 | 4,806.1 | 4,964.5 | 4,923.5 | 4,819.1 | 4,847.1 | 4,683.0 | 4,710.3 |
| 2015 | 4,412.8 | 4,727.4 | 4,662.2 | 5,083.9 | 5,284.0 | 5,295.7 | 5,544.0 | 5,574.6 | 5,343.0 | 5,191.4 | 5,094.3 | 4,932.9 |
| 2016 | 4,624.7 | 5,000.9 | 5,185.0 | 5,305.7 | 5,459.3 | 5,877.6 | 5,875.9 | 5,750.8 | 5,633.8 | 5,288.4 | 5,157.8 | 5,095.7 |
| 2017 | 4,594.7 | 4,822.2 | 4,990.8 | 5,150.9 | 5,354.1 | 5,799.2 | 5,662.8 | 5,725.2 | 5,208.1 | 5,203.9 | 5,102.5 | 5,044.0 |
| 2018 | 4,620.8 | 4,715.3 | 5,043.1 | 5,033.2 | 5,390.2 | 5,479.1 | 5,545.3 | 5,492.5 | 5,321.8 | 5,158.2 | 5,186.7 | 5,110.6 |
| 2019 | 4,717.1 | 4,788.3 | 4,897.9 | 4,995.3 | 5,311.7 | 5,469.7 | 5,793.3 | 5,943.3 | 5,793.0 | 5,663.2 | 5,539.9 | 5,406.2 |
| 2020 | 5,103.9 | 5,431.9 | 4,437.5 | 2,954.5 | 4,110.7 | 5,300.0 | 5,667.3 | 5,789.6 | 5,711.5 | 5,497.7 | 5,227.0 | 4,965.2 |
| 2021 | 4,807.9 | 4,612.6 | 5,114.1 | 5,432.0 | 5,925.7 | 5,997.4 | 6,071.2 | 5,998.0 | 5,870.6 | 5,608.9 | 5,366.8 | 5,199.4 |
| 2022 | 4,642.2 | 5,029.1 | 4,597.3 | |||||||||
| - = No Data Reported; -- = Not Applicable; NA = Not Available; W = Withheld to avoid disclosure of individual company data. |
| Release Date: 5/19/2022 |
| Next Release Date: TBD |