|
Download Data (XLS File) |
|
||||||||
|
||||||||
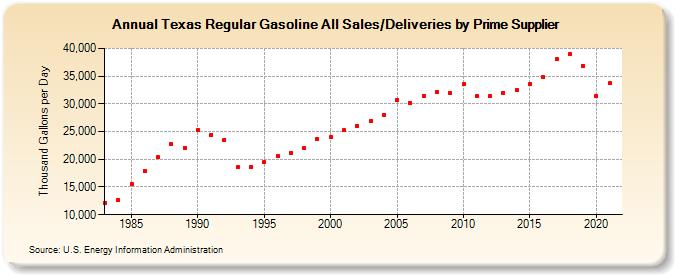
| Texas Regular Gasoline All Sales/Deliveries by Prime Supplier (Thousand Gallons per Day) | ||||||||
| Decade | Year-0 | Year-1 | Year-2 | Year-3 | Year-4 | Year-5 | Year-6 | Year-7 | Year-8 | Year-9 |
|---|---|---|---|---|---|---|---|---|---|---|
| 1980's | 12,163.0 | 12,678.3 | 15,616.8 | 17,962.1 | 20,327.2 | 22,751.1 | 22,077.1 | |||
| 1990's | 25,266.5 | 24,429.4 | 23,537.1 | 18,528.3 | 18,640.0 | 19,551.0 | 20,550.3 | 21,164.4 | 21,998.4 | 23,726.8 |
| 2000's | 23,959.1 | 25,195.9 | 26,045.4 | 26,892.7 | 27,988.0 | 30,694.5 | 30,187.5 | 31,498.9 | 32,160.7 | 31,946.9 |
| 2010's | 33,505.2 | 31,332.9 | 31,449.8 | 32,042.6 | 32,498.1 | 33,534.1 | 34,773.7 | 38,054.6 | 39,002.5 | 36,911.1 |
| 2020's | 31,383.7 |
| - = No Data Reported; -- = Not Applicable; NA = Not Available; W = Withheld to avoid disclosure of individual company data. |
| Release Date: 6/1/2022 |
| Next Release Date: TBD |