|
Download Data (XLS File) |
|
||||||||
|
||||||||
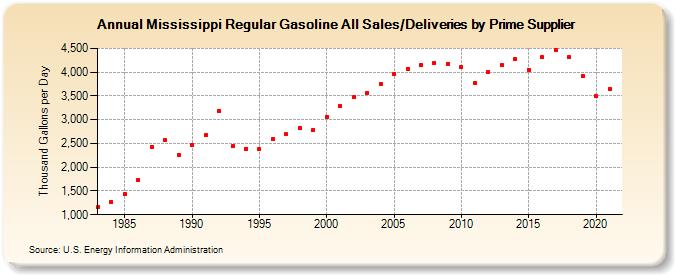
| Mississippi Regular Gasoline All Sales/Deliveries by Prime Supplier (Thousand Gallons per Day) | ||||||||
| Decade | Year-0 | Year-1 | Year-2 | Year-3 | Year-4 | Year-5 | Year-6 | Year-7 | Year-8 | Year-9 |
|---|---|---|---|---|---|---|---|---|---|---|
| 1980's | 1,166.6 | 1,267.6 | 1,436.0 | 1,736.1 | 2,434.8 | 2,567.7 | 2,262.5 | |||
| 1990's | 2,460.9 | 2,670.6 | 3,182.7 | 2,445.7 | 2,390.8 | 2,382.1 | 2,592.6 | 2,690.4 | 2,826.2 | 2,778.5 |
| 2000's | 3,065.6 | 3,293.7 | 3,467.7 | 3,561.1 | 3,742.3 | 3,967.3 | 4,074.5 | 4,156.3 | 4,195.6 | 4,179.3 |
| 2010's | 4,099.3 | 3,776.6 | 3,999.2 | 4,145.5 | 4,279.9 | 4,054.2 | 4,311.9 | 4,465.2 | 4,309.5 | 3,926.0 |
| 2020's | 3,503.0 |
| - = No Data Reported; -- = Not Applicable; NA = Not Available; W = Withheld to avoid disclosure of individual company data. |
| Release Date: 6/1/2022 |
| Next Release Date: TBD |