|
Download Data (XLS File) |
|
||||||||
|
||||||||
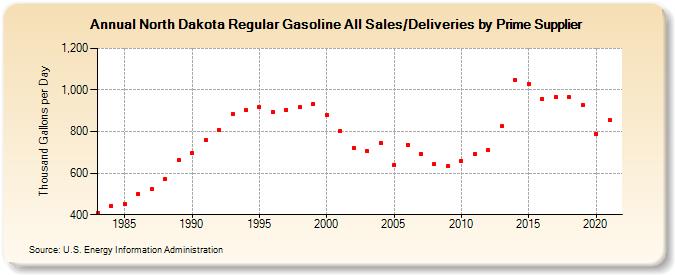
| North Dakota Regular Gasoline All Sales/Deliveries by Prime Supplier (Thousand Gallons per Day) | ||||||||
| Decade | Year-0 | Year-1 | Year-2 | Year-3 | Year-4 | Year-5 | Year-6 | Year-7 | Year-8 | Year-9 |
|---|---|---|---|---|---|---|---|---|---|---|
| 1980's | 409.7 | 444.3 | 452.7 | 501.3 | 521.6 | 572.6 | 663.9 | |||
| 1990's | 696.6 | 760.8 | 808.0 | 885.3 | 904.4 | 915.8 | 894.2 | 905.9 | 917.1 | 933.4 |
| 2000's | 881.8 | 803.9 | 721.0 | 706.1 | 746.2 | 640.7 | 737.3 | 694.2 | 644.2 | 632.9 |
| 2010's | 660.5 | 692.3 | 709.4 | 824.7 | 1,049.2 | 1,030.2 | 958.3 | 966.6 | 965.3 | 927.6 |
| 2020's | 789.9 |
| - = No Data Reported; -- = Not Applicable; NA = Not Available; W = Withheld to avoid disclosure of individual company data. |
| Release Date: 6/1/2022 |
| Next Release Date: TBD |