|
Download Data (XLS File) |
|
||||||||
|
||||||||
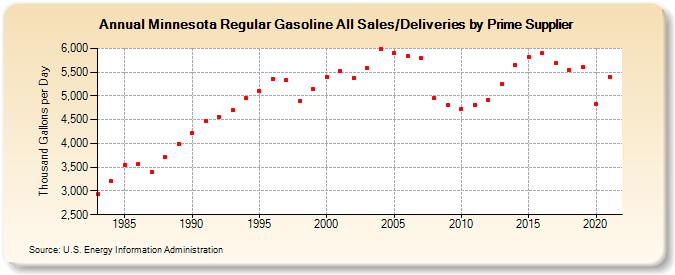
| Minnesota Regular Gasoline All Sales/Deliveries by Prime Supplier (Thousand Gallons per Day) | ||||||||
| Decade | Year-0 | Year-1 | Year-2 | Year-3 | Year-4 | Year-5 | Year-6 | Year-7 | Year-8 | Year-9 |
|---|---|---|---|---|---|---|---|---|---|---|
| 1980's | 2,935.2 | 3,207.9 | 3,552.4 | 3,569.2 | 3,405.3 | 3,712.0 | 3,997.6 | |||
| 1990's | 4,225.0 | 4,464.9 | 4,558.9 | 4,700.3 | 4,956.4 | 5,104.7 | 5,357.4 | 5,339.7 | 4,884.7 | 5,135.1 |
| 2000's | 5,400.4 | 5,524.7 | 5,387.1 | 5,585.0 | 5,985.9 | 5,902.0 | 5,845.6 | 5,790.2 | 4,950.2 | 4,809.0 |
| 2010's | 4,733.6 | 4,811.8 | 4,916.9 | 5,256.0 | 5,648.4 | 5,816.6 | 5,895.8 | 5,694.8 | 5,548.7 | 5,607.2 |
| 2020's | 4,838.1 |
| - = No Data Reported; -- = Not Applicable; NA = Not Available; W = Withheld to avoid disclosure of individual company data. |
| Release Date: 6/1/2022 |
| Next Release Date: TBD |