|
Download Data (XLS File) |
|
||||||||
|
||||||||
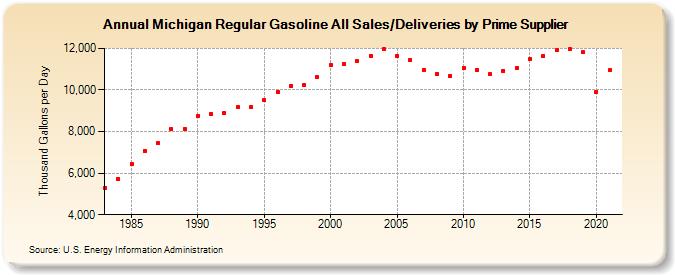
| Michigan Regular Gasoline All Sales/Deliveries by Prime Supplier (Thousand Gallons per Day) | ||||||||
| Decade | Year-0 | Year-1 | Year-2 | Year-3 | Year-4 | Year-5 | Year-6 | Year-7 | Year-8 | Year-9 |
|---|---|---|---|---|---|---|---|---|---|---|
| 1980's | 5,292.9 | 5,737.8 | 6,447.6 | 7,078.0 | 7,446.6 | 8,133.6 | 8,134.1 | |||
| 1990's | 8,768.6 | 8,835.6 | 8,891.5 | 9,187.7 | 9,191.9 | 9,499.8 | 9,909.1 | 10,183.7 | 10,220.4 | 10,609.7 |
| 2000's | 11,207.4 | 11,237.7 | 11,371.0 | 11,644.6 | 11,967.6 | 11,639.8 | 11,432.7 | 10,982.2 | 10,768.6 | 10,687.5 |
| 2010's | 11,064.3 | 10,982.4 | 10,753.4 | 10,929.0 | 11,080.4 | 11,473.5 | 11,655.4 | 11,902.6 | 11,969.4 | 11,803.9 |
| 2020's | 9,912.7 |
| - = No Data Reported; -- = Not Applicable; NA = Not Available; W = Withheld to avoid disclosure of individual company data. |
| Release Date: 6/1/2022 |
| Next Release Date: TBD |