|
Download Data (XLS File) |
|
||||||||
|
||||||||
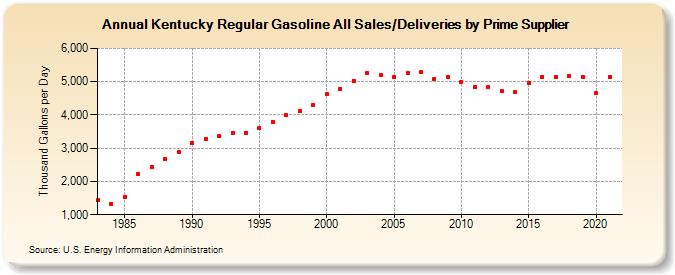
| Kentucky Regular Gasoline All Sales/Deliveries by Prime Supplier (Thousand Gallons per Day) | ||||||||
| Decade | Year-0 | Year-1 | Year-2 | Year-3 | Year-4 | Year-5 | Year-6 | Year-7 | Year-8 | Year-9 |
|---|---|---|---|---|---|---|---|---|---|---|
| 1980's | 1,449.2 | 1,336.7 | 1,543.3 | 2,211.8 | 2,439.0 | 2,685.1 | 2,884.8 | |||
| 1990's | 3,153.0 | 3,290.8 | 3,357.1 | 3,457.9 | 3,465.6 | 3,593.6 | 3,795.2 | 3,989.1 | 4,112.5 | 4,297.5 |
| 2000's | 4,618.5 | 4,791.7 | 5,034.7 | 5,259.7 | 5,194.1 | 5,138.6 | 5,264.7 | 5,280.2 | 5,065.1 | 5,126.1 |
| 2010's | 5,001.7 | 4,850.9 | 4,835.4 | 4,711.1 | 4,677.1 | 4,957.1 | 5,140.4 | 5,147.0 | 5,167.0 | 5,142.4 |
| 2020's | 4,646.9 |
| - = No Data Reported; -- = Not Applicable; NA = Not Available; W = Withheld to avoid disclosure of individual company data. |
| Release Date: 6/1/2022 |
| Next Release Date: TBD |