|
Download Data (XLS File) |
|
||||||||
|
||||||||
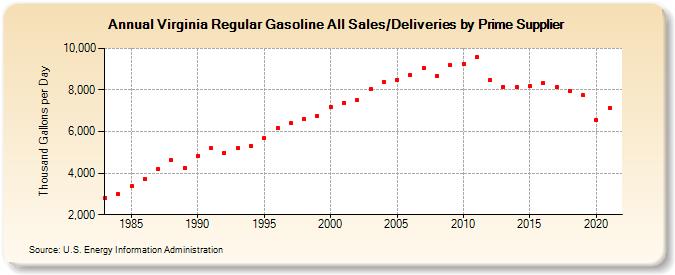
| Virginia Regular Gasoline All Sales/Deliveries by Prime Supplier (Thousand Gallons per Day) | ||||||||
| Decade | Year-0 | Year-1 | Year-2 | Year-3 | Year-4 | Year-5 | Year-6 | Year-7 | Year-8 | Year-9 |
|---|---|---|---|---|---|---|---|---|---|---|
| 1980's | 2,817.3 | 2,995.6 | 3,361.8 | 3,723.1 | 4,185.0 | 4,615.8 | 4,267.1 | |||
| 1990's | 4,847.4 | 5,189.5 | 4,991.2 | 5,208.2 | 5,319.2 | 5,692.8 | 6,180.0 | 6,404.4 | 6,589.5 | 6,769.5 |
| 2000's | 7,186.6 | 7,391.3 | 7,500.9 | 8,029.5 | 8,405.5 | 8,492.2 | 8,731.0 | 9,045.5 | 8,686.0 | 9,200.0 |
| 2010's | 9,271.7 | 9,570.8 | 8,488.6 | 8,166.3 | 8,124.3 | 8,170.1 | 8,313.3 | 8,130.5 | 7,968.9 | 7,739.6 |
| 2020's | 6,547.1 |
| - = No Data Reported; -- = Not Applicable; NA = Not Available; W = Withheld to avoid disclosure of individual company data. |
| Release Date: 6/1/2022 |
| Next Release Date: TBD |