|
Download Data (XLS File) |
|
||||||||
|
||||||||
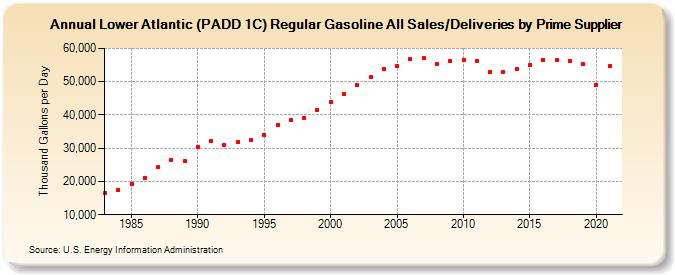
| Lower Atlantic (PADD 1C) Regular Gasoline All Sales/Deliveries by Prime Supplier (Thousand Gallons per Day) | ||||||||
| Decade | Year-0 | Year-1 | Year-2 | Year-3 | Year-4 | Year-5 | Year-6 | Year-7 | Year-8 | Year-9 |
|---|---|---|---|---|---|---|---|---|---|---|
| 1980's | 16,509.0 | 17,483.1 | 19,318.0 | 21,174.9 | 24,287.9 | 26,430.2 | 26,104.5 | |||
| 1990's | 30,371.6 | 32,286.9 | 30,816.5 | 31,796.9 | 32,459.2 | 33,937.9 | 36,915.9 | 38,363.0 | 38,999.6 | 41,597.4 |
| 2000's | 43,816.9 | 46,369.2 | 48,913.8 | 51,359.8 | 53,836.0 | 54,837.6 | 56,686.3 | 57,129.7 | 55,386.9 | 56,221.8 |
| 2010's | 56,523.1 | 56,216.0 | 52,991.6 | 52,882.3 | 53,748.6 | 55,126.2 | 56,627.9 | 56,476.8 | 56,261.8 | 55,238.9 |
| 2020's | 48,943.9 |
| - = No Data Reported; -- = Not Applicable; NA = Not Available; W = Withheld to avoid disclosure of individual company data. |
| Release Date: 6/1/2022 |
| Next Release Date: TBD |