|
Download Data (XLS File) |
|
||||||||
|
||||||||
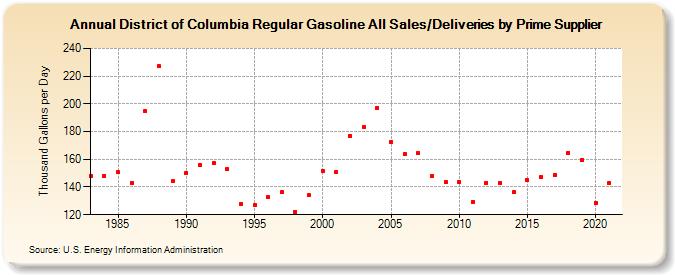
| District of Columbia Regular Gasoline All Sales/Deliveries by Prime Supplier (Thousand Gallons per Day) | ||||||||
| Decade | Year-0 | Year-1 | Year-2 | Year-3 | Year-4 | Year-5 | Year-6 | Year-7 | Year-8 | Year-9 |
|---|---|---|---|---|---|---|---|---|---|---|
| 1980's | 148.1 | 148.2 | 150.6 | 142.9 | 194.6 | 227.1 | 144.1 | |||
| 1990's | 150.4 | 156.0 | 157.4 | 152.9 | 127.7 | 126.7 | 132.7 | 136.2 | 122.3 | 134.0 |
| 2000's | 151.7 | 150.7 | 177.0 | 183.3 | 197.0 | 172.6 | 163.7 | 164.7 | 147.8 | 143.6 |
| 2010's | 143.3 | 129.2 | 143.2 | 142.7 | 136.1 | 144.7 | 147.2 | 148.7 | 164.8 | 159.8 |
| 2020's | 128.5 |
| - = No Data Reported; -- = Not Applicable; NA = Not Available; W = Withheld to avoid disclosure of individual company data. |
| Release Date: 6/1/2022 |
| Next Release Date: TBD |