|
Download Data (XLS File) |
|
||||||||
|
||||||||
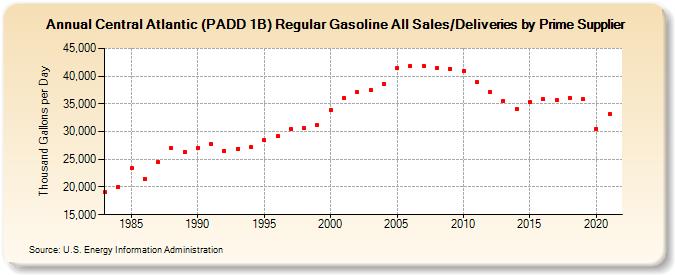
| Central Atlantic (PADD 1B) Regular Gasoline All Sales/Deliveries by Prime Supplier (Thousand Gallons per Day) | ||||||||
| Decade | Year-0 | Year-1 | Year-2 | Year-3 | Year-4 | Year-5 | Year-6 | Year-7 | Year-8 | Year-9 |
|---|---|---|---|---|---|---|---|---|---|---|
| 1980's | 19,049.7 | 20,077.3 | 23,339.9 | 21,498.3 | 24,439.4 | 27,002.4 | 26,377.7 | |||
| 1990's | 27,104.0 | 27,712.0 | 26,514.2 | 26,907.8 | 27,199.3 | 28,412.0 | 29,116.4 | 30,400.1 | 30,569.1 | 31,113.7 |
| 2000's | 33,939.1 | 36,085.5 | 37,069.7 | 37,534.8 | 38,585.2 | 41,422.8 | 41,827.4 | 41,856.1 | 41,546.7 | 41,371.9 |
| 2010's | 40,836.0 | 38,861.3 | 37,212.8 | 35,474.6 | 34,025.6 | 35,322.4 | 35,821.8 | 35,738.8 | 36,105.9 | 35,819.9 |
| 2020's | 30,483.3 |
| - = No Data Reported; -- = Not Applicable; NA = Not Available; W = Withheld to avoid disclosure of individual company data. |
| Release Date: 6/1/2022 |
| Next Release Date: TBD |