|
Download Data (XLS File) |
|
||||||||
|
||||||||
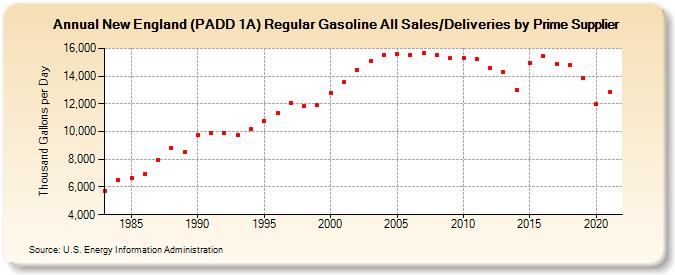
| New England (PADD 1A) Regular Gasoline All Sales/Deliveries by Prime Supplier (Thousand Gallons per Day) | ||||||||
| Decade | Year-0 | Year-1 | Year-2 | Year-3 | Year-4 | Year-5 | Year-6 | Year-7 | Year-8 | Year-9 |
|---|---|---|---|---|---|---|---|---|---|---|
| 1980's | 5,722.4 | 6,494.4 | 6,666.4 | 6,928.0 | 7,922.4 | 8,806.1 | 8,517.1 | |||
| 1990's | 9,776.6 | 9,899.7 | 9,883.6 | 9,718.9 | 10,159.0 | 10,790.2 | 11,323.2 | 12,053.1 | 11,877.6 | 11,903.0 |
| 2000's | 12,782.1 | 13,587.8 | 14,470.8 | 15,093.2 | 15,520.6 | 15,623.1 | 15,500.8 | 15,656.8 | 15,496.4 | 15,293.0 |
| 2010's | 15,324.8 | 15,250.2 | 14,549.5 | 14,308.2 | 12,991.3 | 14,948.2 | 15,438.5 | 14,897.9 | 14,799.1 | 13,866.2 |
| 2020's | 11,999.5 |
| - = No Data Reported; -- = Not Applicable; NA = Not Available; W = Withheld to avoid disclosure of individual company data. |
| Release Date: 6/1/2022 |
| Next Release Date: TBD |